OOF2: The Manual
| 4.7.9. The Mesh Cross Section Toolbox | ||
|---|---|---|

|
4.7. Toolboxes |  |
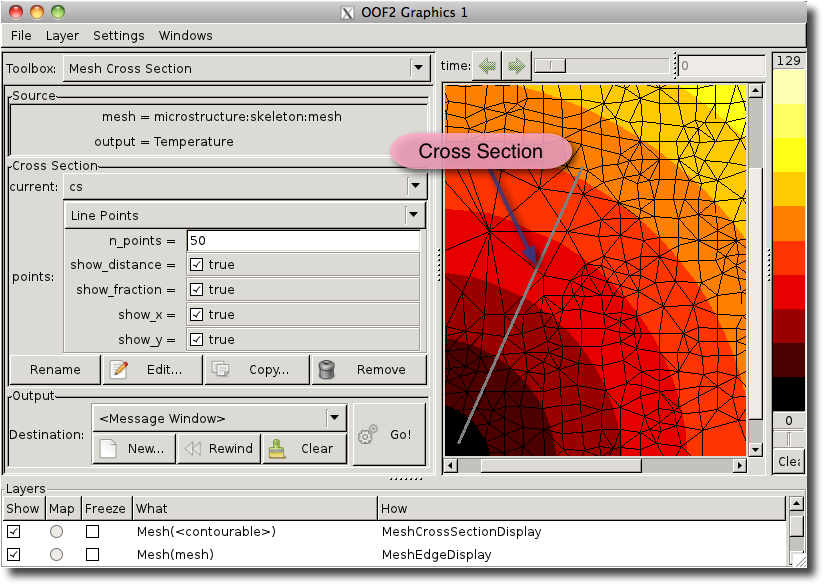
The Mesh Cross Section Toolbox is used to create cross sections
within a Mesh. A cross section is a line (or curve, eventually)
drawn in a Mesh along which output values can be computed by the
commands on the Analysis
Page. When the Mesh Cross Section Toolbox is active,
clicking and dragging the mouse on the Canvas will create a new
cross section, as shown in Figure 4.17.
In addition, when a contour plot is displayed on the Canvas, the
Toolbox provides a quick way of evaluating the contoured values
along the cross section.
When the Toolbox is active, clicking and dragging the mouse on the
Canvas will create a new CrossSection
via the OOF.Mesh.Cross_Section.New
command. New cross sections are automatically named
cs or cs<x>,
where x is an integer. New cross sections
can also be created on the Analysis page when
Domain is set to Cross Section.
The Toolbox is divided into three panes, as shown in the figure. It may be necessary to resize the Graphics Window to see the whole Toolbox.
The Source pane lists the Mesh that's
displayed in the Canvas and says what data is being plotted in
the topmost contour plot Layer.
The Cross Section pane allows the user to choose which cross section is current, and to edit the attributes of the current cross section.
The pull-down menu labelled current is used
to select
the current cross section. It contains all of the cross sections
defined on the Mesh, plus the entry
<None>, which deselects all cross
sections. When a new cross section is created by clicking and
dragging the mouse on the Canvas, it becomes the current cross
section.
The current cross section, if there is one, is displayed on the
Canvas by a predefined MeshCrossSectionDisplay Layer. To
change the display parameters, first enable List
All Layers in the Settings
menu, select the layer in the Layer List, and
edit it..
To turn off the display, it's easier to set the
current cross section to
<None>, rather than to hide the
MeshCrossSectionDisplay
Layer.
The points menu and associated parameters determines how the cross section will be sampled when the button is pressed. The parameters for the sampling method also determine which auxiliary quantities (position, arc length, etc.) will be output along with the data.
The
button renames the current cross section. If the new name
conflicts with another cross section in the Mesh,
<x> will be appended to it for some
integer x.
The button brings up a dialog box for changing the end points of the current cross section. When OOF2 supports curved cross sections, the dialog will allow the cross section type to be changed as well.
The
button copies the current cross section. It may be copied
either to the current Mesh or to a different one. In either
case, the name of the copy must be unique in the destination
mesh. If it is not, <x> will be
appended to it with an integer x.
The button evaluates the output (displayed in the contour plot) at the sampling points (determined by points) along the current cross section, and sends the results to the file selected in the Destination menu.
The Destination widgets are identical to those in the Analysis and Boundary Analysis pages. As on those pages, the format of the output file can be adjusted by the OOF.Settings.Output_Formatting menu in the main OOF2 window.
|
|
 |
|
| 4.7. Toolboxes |  |
4.8. The Layer Editor |