OOF2: The Manual
| 3.16. The Analysis Page | ||
|---|---|---|

|
Chapter 3. Task Pages |  |
The analysis page provides tools to examine the state of the physical system modelled by a given mesh. The data can be output directly to a file or to the screen, for examination or plotting by other software, or it can be examined by one of the provided statistical tools.
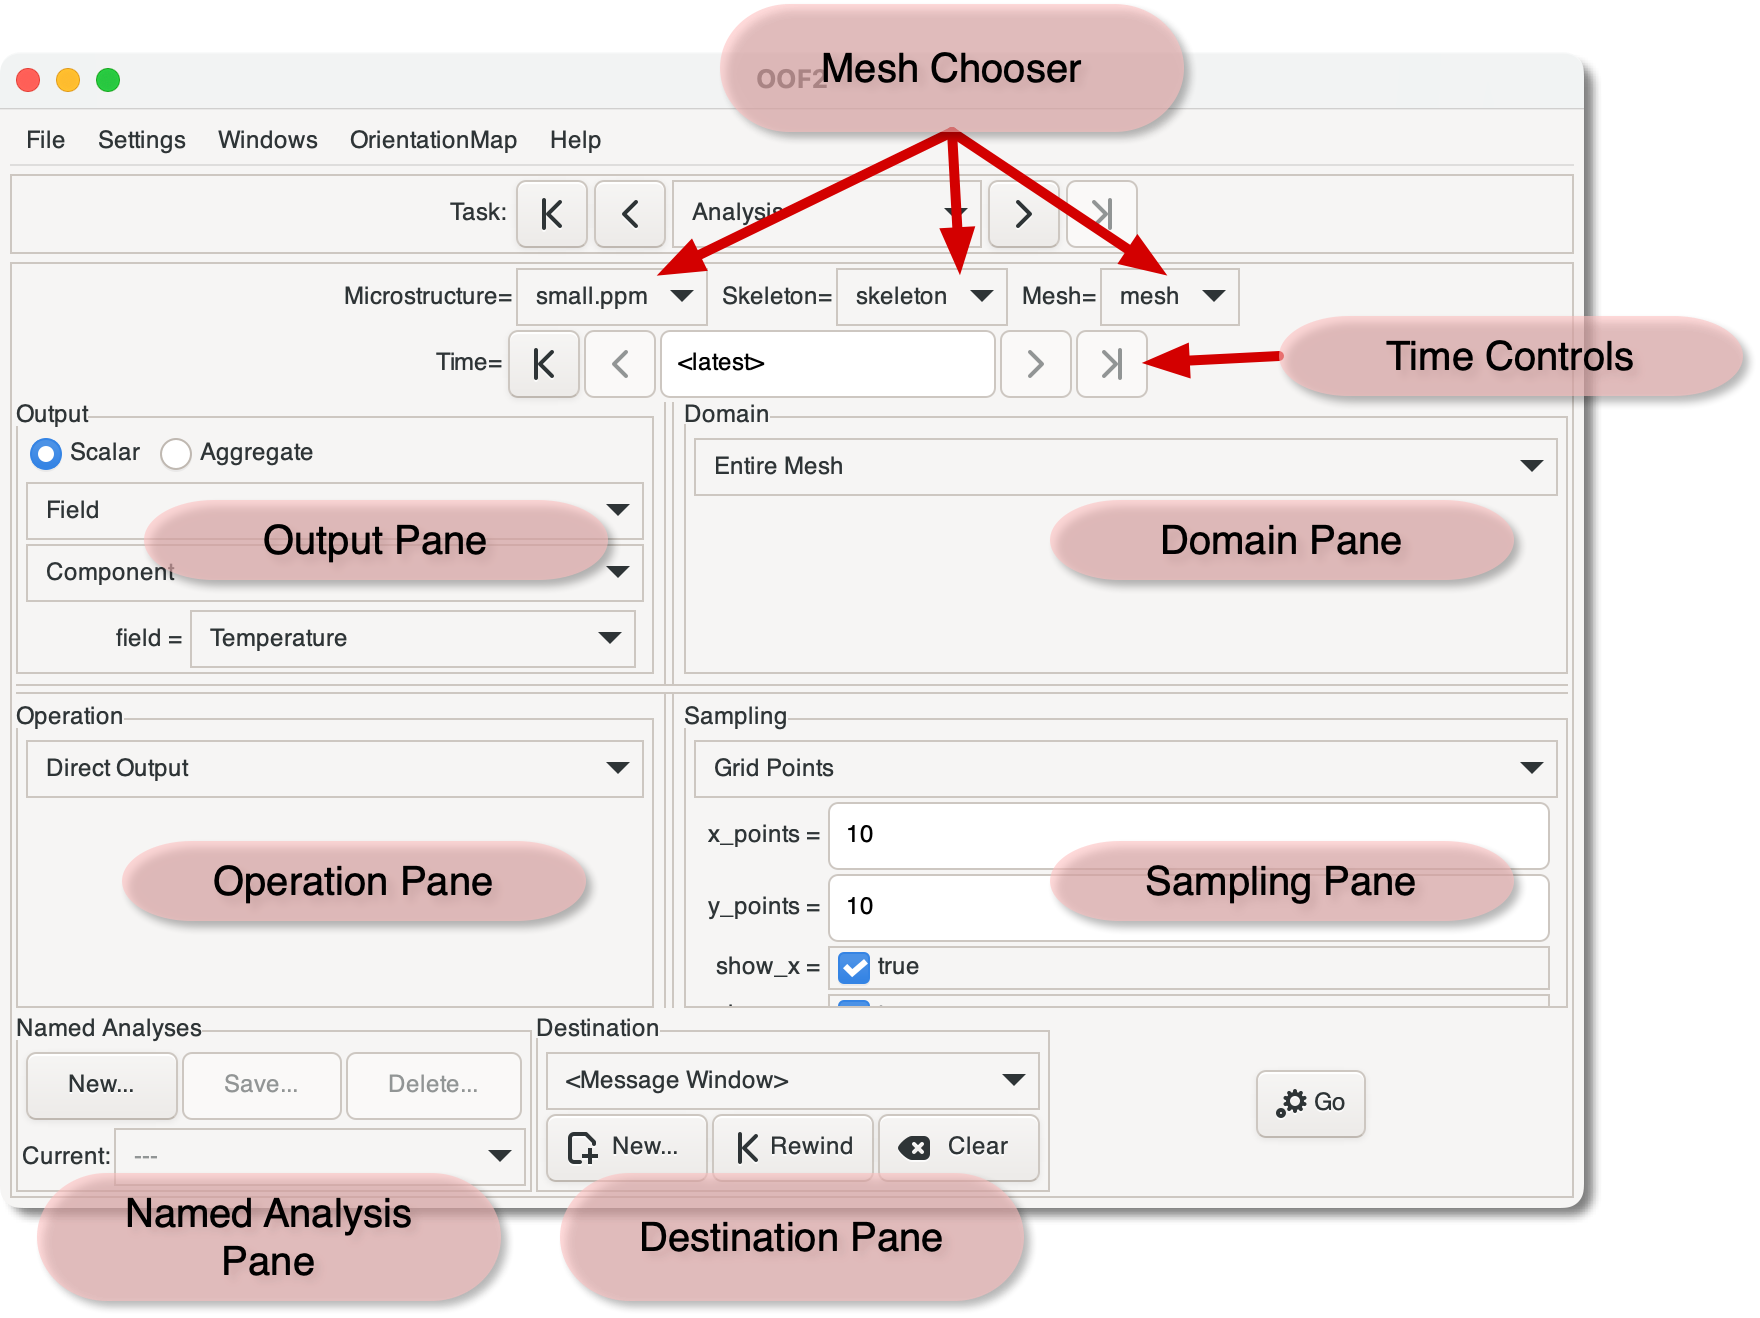
The anatomy of the page is shown in Figure 3.25. It begins with widgets for
choosing which Mesh will be the source of the data. Below the
Mesh Chooser are the Time Controls, which
selects the time
at which the data will be extracted from the Mesh. The main
part of the page consists of four panes, Output,
Operation,
Domain,
and Sampling,
which define the analysis operation. At the bottom of the page are
the Named
Analysis pane, which allows analysis settings to
be saved and restored, the Destination
pane, which determine where the results of the analysis are
displayed or stored, and the Go button, which
performs the analysis.
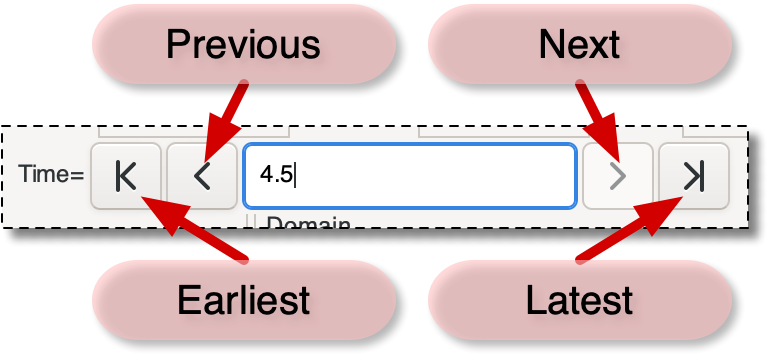
The analyses performed by this page are all computed on data from a particular time. If the solution was a static solution, it contains only one time, and the Time Controls are irrelevant. If the solution was a time evolution, the Time Controls determine the time at which the analysis will be done.
Figure 3.26 shows the Time Controls
from Figure 3.25. The central box
displays the selected time. A new time can be selected by
simply typing it into the box, or by using the buttons on either
side. The buttons will only change the values to times that are
stored in the Mesh (that is, the start and end times, and
times that were specified in Scheduled
Outputs), but any time between the Mesh's earliest and
latest times can be entered into the central box. If the box
contains a time that's not stored, the analysis will be based on
interpolated Field values.
The buttons marked “Earliest” and
“Latest” in Figure 3.26
set the time to the first and last times stored in the Mesh.
When these are used, the central box will read
<earliest> or
<latest> instead of a numerical
time. These placeholders always refer to the first and last
times in the Mesh, even if the mesh data changes. The default
setting for this widget is
<latest>.
This pane selects the output data which will be sampled on the
mesh. The result is one of the available output types. The buttons at
the top of the pane, labelled and
, determine whether the
pull-down menus below them list the scalar outputs
(e.g, a component of a Field or
Flux) or aggregate
outputs (e.g, all of the
components of a Field or Flux).
The operation pane determines what actually happens when the button is pressed. The operation is one of the OOF.Mesh.Analyze menu items.
The region or subset of the Mesh on which the operation
should be performed is selected here. The selection will be
one of the Domain types,
which define different ways of defining subregions of various
dimensions.
When the domain is set to Cross
Section, the pane will look like Figure 3.27. Cross
sections are lines drawn through the Microstructure. They may
begin and end on interior points or on edges. Existing cross
sections may be selected with the chooser. New cross sections
may be defined with the
button, which brings up a dialog box in which the coordinates
of the endpoints must be typed. New cross sections can also
be created graphically using the Mesh Cross
Section toolbox in the Graphics window.
The remaining buttons in the cross section widget, , , , and do what you would expect them to do. When a cross section is removed from the chooser here, it is also removed from the Mesh Cross Section toolbox.
When the Domain is set to Edge
Boundary, the boundary may lie between two
elements, and the quantity being computed may have different
results on different sides of the boundary. Therefore it's
necessary to specify which side of the boundary to use by
setting the side parameter to
LEFT or RIGHT,
as shown in Figure 3.27. See SegmentSide for a discussion of how
LEFT and RIGHT
are defined.
When Domain is set to Pixel
Group or Element
Group, it's possible to choose a group name,
or <selection> to set the domain
to the currently selected pixels or Elements.
Figure 3.27. Two Versions of the Domain Pane
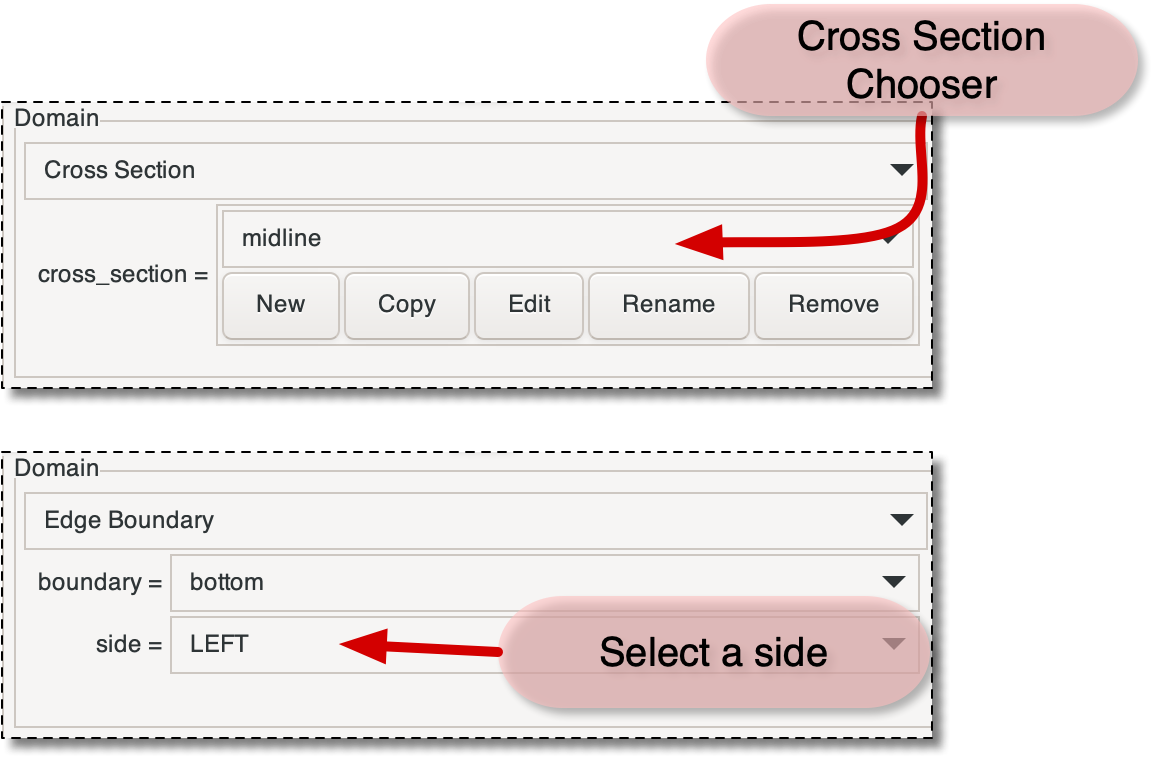
When the domain is set to Cross Section the Domain Pane will look like the upper image. When it's set to Edge Boundary, the pane will look like the lower image. Other settings are simpler.
Outputs cannot in general be evaluated directly on the domains, they have to be evaluated at particular points on the mesh, and depending on the desired operation, the resulting pointwise data may need to be combined in some way.
The pull-down menu in the sampling pane selects a set of
points on which to evaluate the output, and the result is one
of the SampleSet objects.
Note that the available sample sets will depend on the current settings of the Domain and Operation panes.
The Named Analyses pane assigns a name to the current settings of the Output, Operation, Domain, and Sampling panes and allows those settings to be reloaded into the panes or to be used as a Scheduled Output during time evolution computations.
The Named Analysis pane consists of three buttons labeled , , and Delete and a pull-down menu named Current.
-
New. Create a new Named Analysis using the current settings of the Output, Operation, Domain, and Sampling panes. A dialog box will appear asking for a name, which may be generated automatically. Clicking creates the Named Analysis.
The new name must be unique among all Named Analyses on all
Meshes, including any Named Analyses created on the Boundary Analysis page. If the name is not unique,<x>will be appended to it, wherexis an integer. -
Save. Save the definitions of the Named Analyses to a file. A file chooser dialog will appear. The names list in the dialog contains all of the Named Analyses. The selected ones will be saved when the is pressed. Multiple names can be selected by shift-clicking in the list.
-
Delete. A dialog box will appear listing all of the Named Analyses. Selecting one and clicking will delete it.
The pulldown menu labelled Current displays the name of the current settings of the Output, Operation, Domain, and Sampling panes. If no name has been assigned to the current configuration, the menu label will be blank. Selecting a name in the menu will switch the panes to the selected configuration.
The Destination pane determines where the data generated by the analysis tool will be written. Data can appear in the message window, in a previously specified file, or in a new file.
The components of the pane are:
-
Destination Chooser. The pull-down menu at the top of the pane selects a previously defined destination. Initially, the menu only contains
<Message
                        		        Window>
. -
New. The button brings up a file selector dialog box. The
modeparameter is a WriteMode and can be set towriteorappend. If the file already exists,writechanges toOVERWRITE, to make sure you notice. Preexisting content in files opened inOVERWRITEmode will be deleted.If the selected file has already been used for output in this OOF2 session, the new data will be appended to it, even if it was opened in
writeorOVERWRITEmode, unless it has been rewound. -
Rewind. After rewinding an output file, any new data written to the file will overwrite its previous contents. The file will not be cleared until new data is written. This operation has no effect on
<Message Window>. -
Clear. Remove all of the files from the list, except for the
<Message Window>. Afterwards, any files opened will be treated as if they're new, so data will be overwritten if they're opened inwriteorOVERWRITEmode.
A file opened in the Destination pane is
handled identically to a file opened as an OutputStream in the Scheduled
Output page. An OutputStream created on that page
will appear as a predefined destination on this page. Rewinding
a file there has the same effect as rewinding it on this page.
The format of the output file can be adjusted by the OOF.Settings.Output_Formatting menu in the main OOF2 window.
The Go button in the bottom right corner of the page invokes the command in the OOF.Mesh.Analyze menu specified by the Operation pane. Data from the Output, Domain, Sampling, and Destination panes are passed as arguments to the command.
If the Go button is not sensitized,
either some data is missing from one of the panes, the time widget has
an invalid setting, the Mesh is out of sync with
its Skeleton, or the Output is incomputable on the Mesh.
|
|
 |
|
| 3.15. The Solver Page |  |
3.17. The Boundary Analysis Page |