OOF2: The Manual
| 4.4. Contour Map | ||
|---|---|---|

|
Chapter 4. The Graphics Window |  |
The Contour Map Pane at the right side of the Graphics Window displays the contour levels used in contour plots in the Canvas. There are two forms for the Contour Map, shown in Figure 4.4. The form on the left is used for filled contours and other plots that assign (“map”) colors to numerical values. The second form is used for contour line plots.
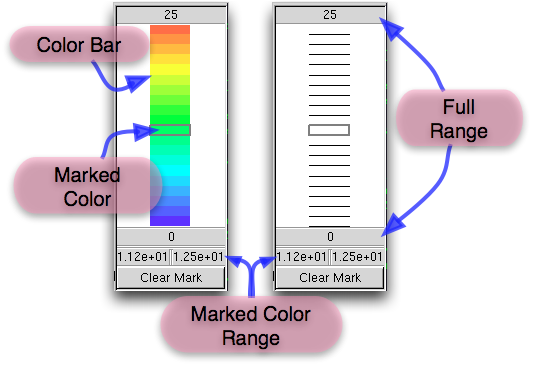
The two forms of the Contour Map differ only in their central map regions: one form displays a Color Bar, and the other only shows a set of lines. The positions of the colors and lines correspond to the numerical values assigned to colors and lines in the plot in the Canvas. The values assigned to the top and bottom colors and lines are indicated immediately above and below the map (shown as “Full Range” in the figure).
Clicking on a color or on a space between two lines marks a range of values. The minimum and maximum values in the range are shown in the boxes right below the Full Range minimum. The button marked simply removes the mark from the map.
Several aspects of the Contour Map display may be controlled in the Settings menu. A PDF image of the Contour Map may be saved to a file with the Save Contourmap command in the File menu.
|
|
 |
|
| 4.3. The Layer List |  |
4.5. Setting the Time |