-
Citation: Y. Oh, W.-S. Ko, N. Kwak, J.-i. Jang, T. Ohmura, and H.N. Han (2022), "Small-scale analysis of brittle-to-ductile transition behavior in pure tungsten", Journal of Materials Science & Technology 105, 242–258. DOI: 10.1016/j.jmst.2021.07.024.Abstract: Tungsten as a material exhibits broad and increasingly important applications; however, the characterization of its ductile-to-brittle transition (BDT) is currently limited to large-scale scenarios and destructive testing. In this study, we overcome this challenge by implementing small-scale techniques to provide a comprehensive understanding of the BDT behavior of pure tungsten. In order to predict the failure mode at various temperature ranges, the practical fracture analysis diagram has been proposed to describe the resistance to shear flow and cracking behavior with temperature. High temperature nano-indentation tests have provided the inherent mechanical responses corresponding to the maximum shear stress at various temperatures, which is required for dislocation activities in an atomic scaled activation volume. On one hand, atomistic simulations have provided the temperature dependence of brittle fracture stress, where the atomic bonds break due to intergranular or intragranular fracture. We considered four tungsten specimens having various microstructures prepared using different processing conditions of cold-rolling and post-annealing, and their BDT ranges were inferred using the obtained fracture analysis diagram with the statistical data processing. The fracture analysis diagram of each specimen obtained were compared with the direct observation of fracture responses in macroscopic mechanical tests, which conclusively indicated that the small-scale inherent mechanical properties are greatly relevant to the macroscopic BDT behavior in pure tungsten. Based on the BDT estimations by small-scale characterization, we provided further insights into the factors affecting the BDT behavior of tungsten, focusing on the contributions of different types of dislocations.
Related Models: -
LAMMPS pair_style meam (2022--Oh-Y--W--LAMMPS--ipr1)See Computed Properties
Notes: These files were created by extracting the W element parameters from the 2024--Oh-Y--W-H--LAMMPS--ipr1 listing. The cutoff distance was set to 6.0 Angstrom and the cutoff truncation set to 2.0 Angstrom to match what was used in the above reference. The files are posted with approval from Won-Seok Ko.
File(s):
Implementation Information
Diatom Energy vs. Interatomic Spacing
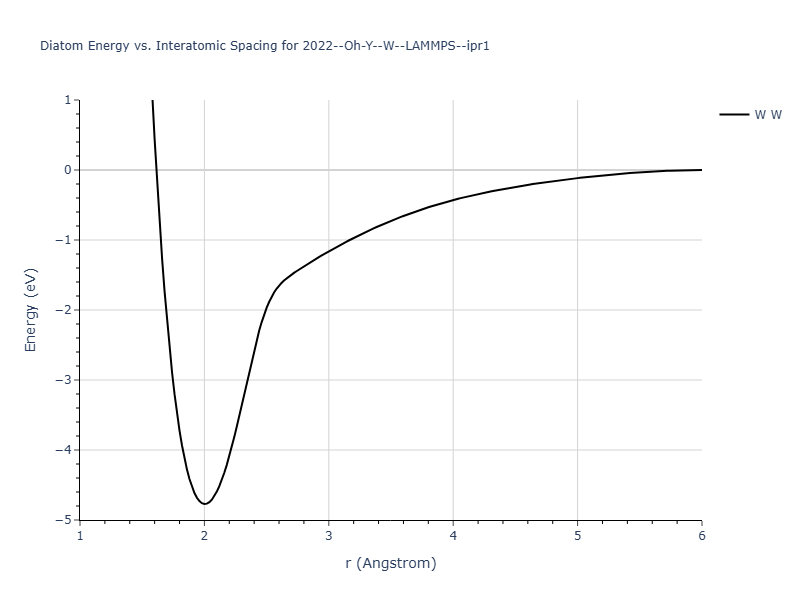
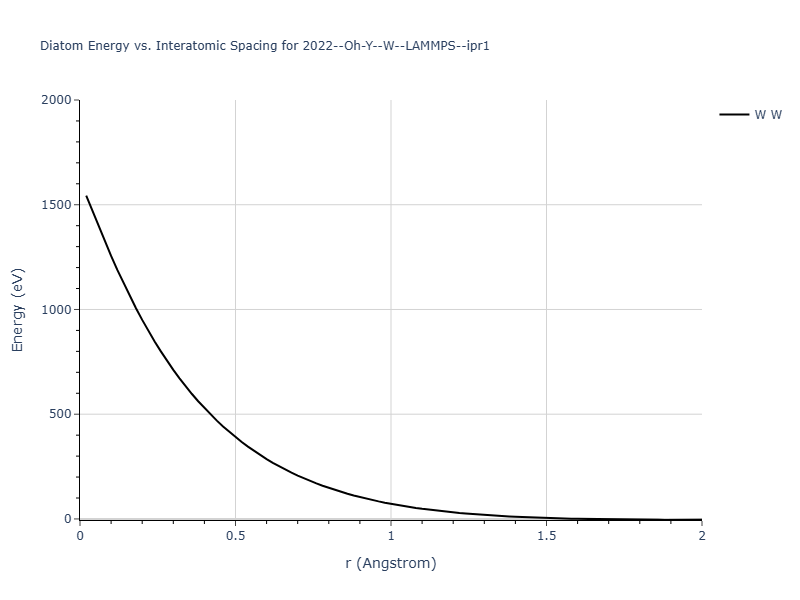
Plots of the potential energy vs interatomic spacing, r, are shown below for all diatom sets associated with the interatomic potential. This calculation provides insights into the functional form of the potential's two-body interactions. A system consisting of only two atoms is created, and the potential energy is evaluated for the atoms separated by 0.02 Å <= r <= 6.0> Å in intervals of 0.02 Å. Two plots are shown: one for the "standard" interaction distance range, and one for small values of r. The small r plot is useful for determining whether the potential is suitable for radiation studies.
The calculation method used is available as the iprPy diatom_scan calculation method.
Clicking on the image of a plot will open an interactive version of it in a new tab. The underlying data for the plots can be downloaded by clicking on the links above each plot.
Notes and Disclaimers:
- These values are meant to be guidelines for comparing potentials, not the absolute values for any potential's properties. Values listed here may change if the calculation methods are updated due to improvements/corrections. Variations in the values may occur for variations in calculation methods, simulation software and implementations of the interatomic potentials.
- As this calculation only involves two atoms, it neglects any multi-body interactions that may be important in molecules, liquids and crystals.
- NIST disclaimer
Version Information:
- 2019-11-14. Maximum value range on the shortrange plots are now limited to "expected" levels as details are otherwise lost.
- 2019-08-07. Plots added.
Click on plot to load interactive version
Click on plot to load interactive version
Cohesive Energy vs. Interatomic Spacing
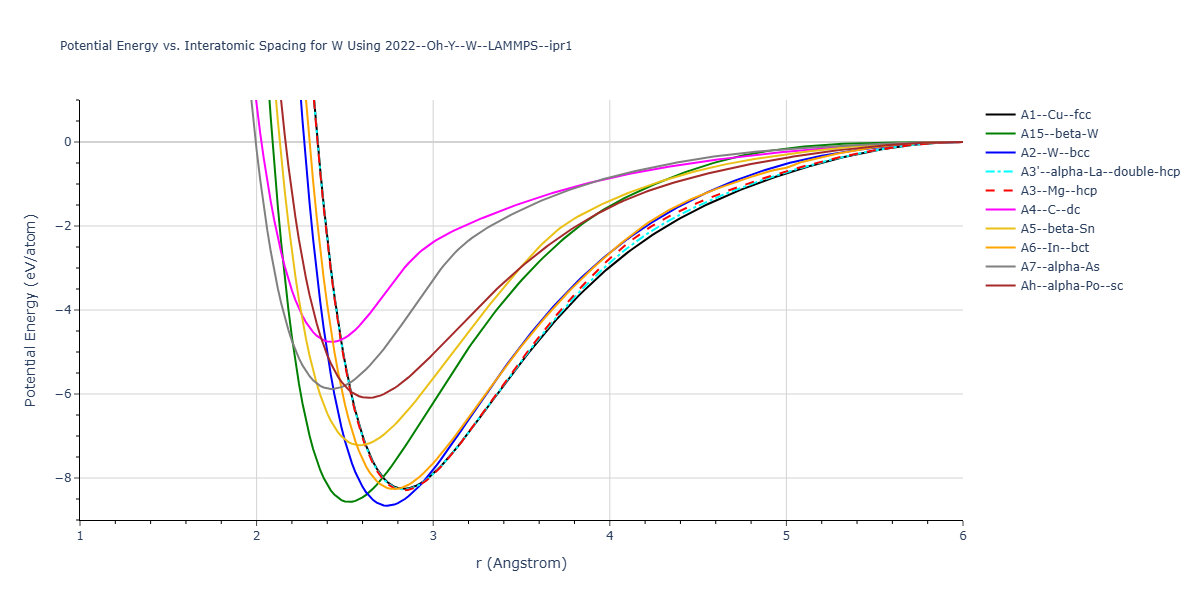
Plots of potential energy vs interatomic spacing, r, are shown below for a number of crystal structures. The structures are generated based on the ideal atomic positions and b/a and c/a lattice parameter ratios for a given crystal prototype. The size of the system is then uniformly scaled, and the energy calculated without relaxing the system. To obtain these plots, values of r are evaluated every 0.02 Å up to 6 Å.
The calculation method used is available as the iprPy E_vs_r_scan calculation method.
Clicking on the image of a plot will open an interactive version of it in a new tab. The underlying data for the plots can be downloaded by clicking on the links above each plot.
Notes and Disclaimers:
- These values are meant to be guidelines for comparing potentials, not the absolute values for any potential's properties. Values listed here may change if the calculation methods are updated due to improvements/corrections. Variations in the values may occur for variations in calculation methods, simulation software and implementations of the interatomic potentials.
- The minima identified by this calculation do not guarantee that the associated crystal structures will be stable since no relaxation is performed.
- NIST disclaimer
Version Information:
- 2020-12-18. Descriptions, tables and plots updated to reflect that the energy values are the measuredper atom potential energy rather than cohesive energy as some potentials have non-zero isolated atom energies.
- 2019-02-04. Values regenerated with even r spacings of 0.02 Å, and now include values less than 2 Å when possible. Updated calculation method and parameters enhance compatibility with more potential styles.
- 2019-04-26. Results for hcp, double hcp, α-As and L10 prototypes regenerated from different unit cell representations. Only α-As results show noticable (>1e-5 eV) difference due to using a different coordinate for Wykoff site c position.
- 2018-06-13. Values for MEAM potentials corrected. Dynamic versions of the plots moved to separate pages to improve page loading. Cosmetic changes to how data is shown and updates to the documentation.
- 2017-01-11. Replaced png pictures with interactive Bokeh plots. Data regenerated with 200 values of r instead of 300.
- 2016-09-28. Plots for binary structures added. Data and plots for elemental structures regenerated. Data values match the values of the previous version. Data table formatting slightly changed to increase precision and ensure spaces between large values. Composition added to plot title and structure names made longer.
- 2016-04-07. Plots for elemental structures added.