Download raw data (including filtered results)
Reference structure matches:
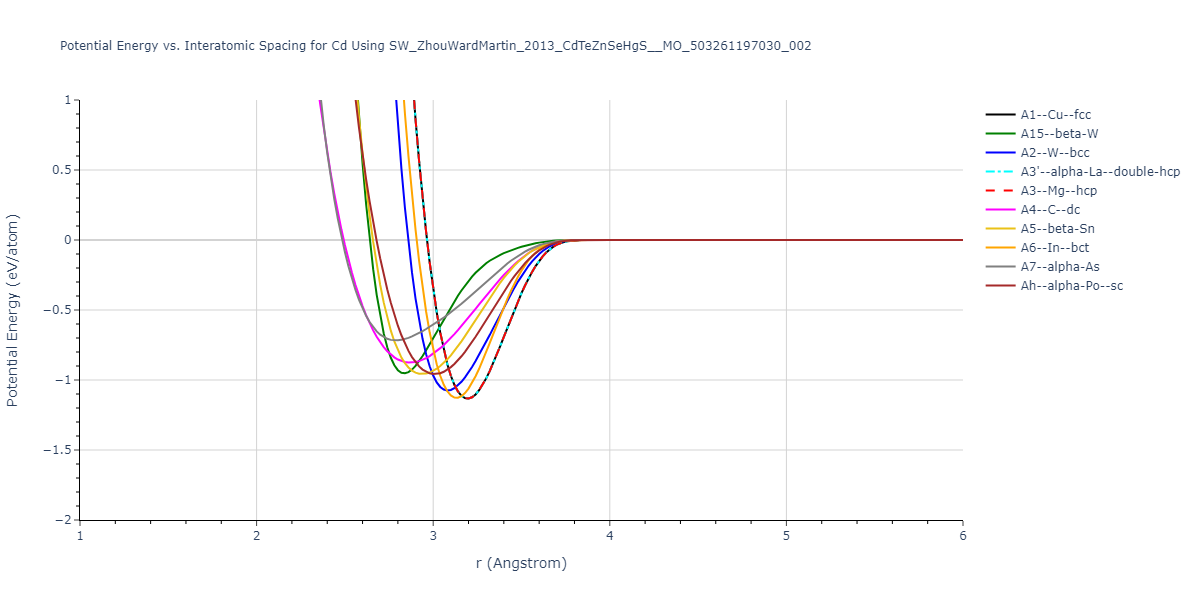
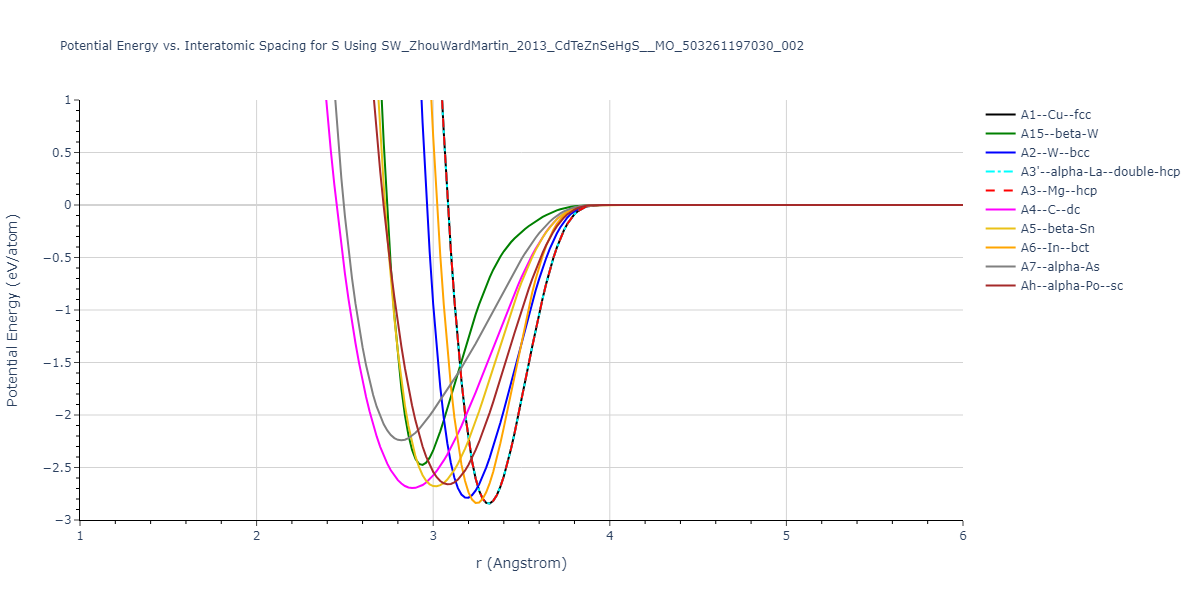
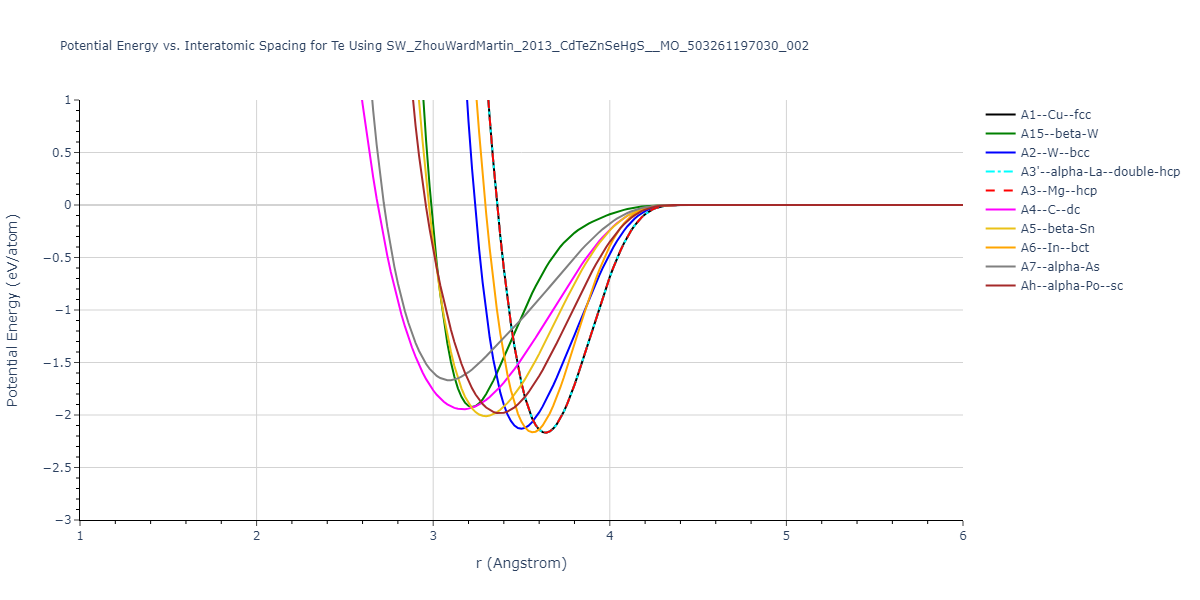
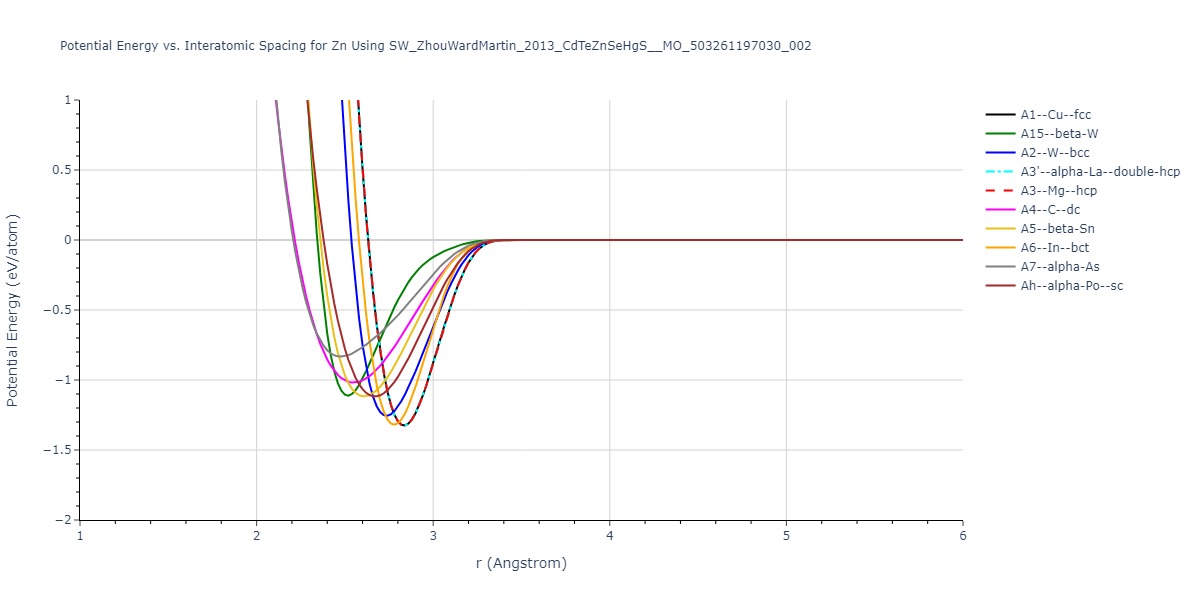
A1--Cu--fcc = mp-1096861, oqmd-1214514
A15--beta-W = oqmd-1214959, oqmd-1280370
A2--W--bcc = oqmd-1215137
A3'--alpha-La--double-hcp = mp-1183591, oqmd-1215405
A3--Mg--hcp = mp-94, oqmd-593871, oqmd-594050, oqmd-594525, oqmd-598515, oqmd-616212, oqmd-636839, oqmd-1215315
A4--C--dc = oqmd-1215494
A5--beta-Sn = oqmd-1215583
A6--In--bct = oqmd-1215672
| prototype | method | Ecoh (eV/atom) | Epot (eV/atom) | a0 (Å) | b0 (Å) | c0 (Å) | α (degrees) | β (degrees) | γ (degrees) |
|---|
| A1--Cu--fcc | dynamic | -1.133 | -1.133 | 4.518 | 4.518 | 4.518 | 90.0 | 90.0 | 90.0 |
| A3--Mg--hcp | dynamic | -1.133 | -1.133 | 3.1947 | 3.1947 | 5.2169 | 90.0 | 90.0 | 120.0 |
| A3'--alpha-La--double-hcp | box | -1.133 | -1.133 | 3.1947 | 3.1947 | 10.4339 | 90.0 | 90.0 | 120.0 |
| oqmd-1216028 | static | -1.133 | -1.133 | 3.1946 | 3.1946 | 23.4773 | 90.0 | 90.0 | 120.0 |
| oqmd-1215226 | box | -1.1303 | -1.1303 | 3.2347 | 5.4618 | 5.217 | 90.0 | 90.0 | 90.0 |
| A2--W--bcc | static | -1.0753 | -1.0753 | 3.5593 | 3.5593 | 3.5593 | 90.0 | 90.0 | 90.0 |
| oqmd-1214870 | dynamic | -1.0657 | -1.0657 | 7.8455 | 7.8455 | 7.8455 | 90.0 | 90.0 | 90.0 |
| oqmd-1214870 | box | -1.0622 | -1.0622 | 7.8332 | 7.8332 | 7.8332 | 90.0 | 90.0 | 90.0 |
| oqmd-1214781 | dynamic | -1.0471 | -1.0471 | 11.0795 | 11.0795 | 11.0795 | 90.0 | 90.0 | 90.0 |
| oqmd-1214781 | box | -1.032 | -1.032 | 11.0691 | 11.0691 | 11.0691 | 90.0 | 90.0 | 90.0 |
| A7--alpha-As | box | -0.9886 | -0.9886 | 4.9924 | 4.9924 | 6.3397 | 90.0 | 90.0 | 120.0 |
| oqmd-1214692 | dynamic | -0.9828 | -0.9828 | 5.0584 | 8.526 | 5.3898 | 90.0 | 90.0 | 90.0 |
| oqmd-1214692 | box | -0.9803 | -0.9803 | 4.9936 | 8.8149 | 5.2555 | 90.0 | 90.0 | 90.0 |
| A5--beta-Sn | static | -0.9686 | -0.9686 | 5.7494 | 5.7494 | 3.0379 | 90.0 | 90.0 | 90.0 |
| Ah--alpha-Po--sc | dynamic | -0.9583 | -0.9583 | 3.0079 | 3.0079 | 3.0079 | 90.0 | 90.0 | 90.0 |
| A15--beta-W | static | -0.9525 | -0.9525 | 5.6722 | 5.6722 | 5.6722 | 90.0 | 90.0 | 90.0 |
| oqmd-1277934 | dynamic | -0.9379 | -0.9379 | 14.4363 | 14.4363 | 14.4363 | 90.0 | 90.0 | 90.0 |
| oqmd-1277934 | box | -0.9302 | -0.9302 | 14.376 | 14.376 | 14.376 | 90.0 | 90.0 | 90.0 |
| oqmd-1215761 | box | -0.9046 | -0.9046 | 3.7034 | 3.7034 | 6.388 | 90.0 | 90.0 | 120.0 |
| A4--C--dc | dynamic | -0.8757 | -0.8757 | 6.6271 | 6.6271 | 6.6271 | 90.0 | 90.0 | 90.0 |
| oqmd-1215939 | box | -0.7797 | -0.7797 | 5.0157 | 5.0157 | 6.0158 | 90.0 | 90.0 | 120.0 |
Download raw data (including filtered results)
Reference structure matches:
| prototype | method | Ecoh (eV/atom) | Epot (eV/atom) | a0 (Å) | b0 (Å) | c0 (Å) | α (degrees) | β (degrees) | γ (degrees) |
|---|
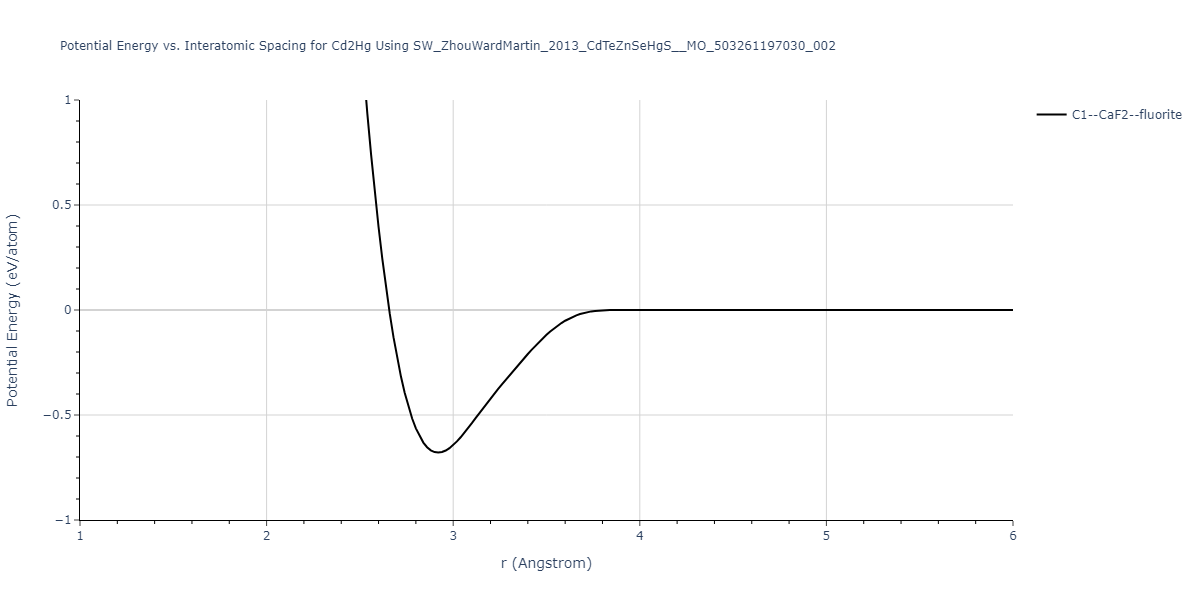
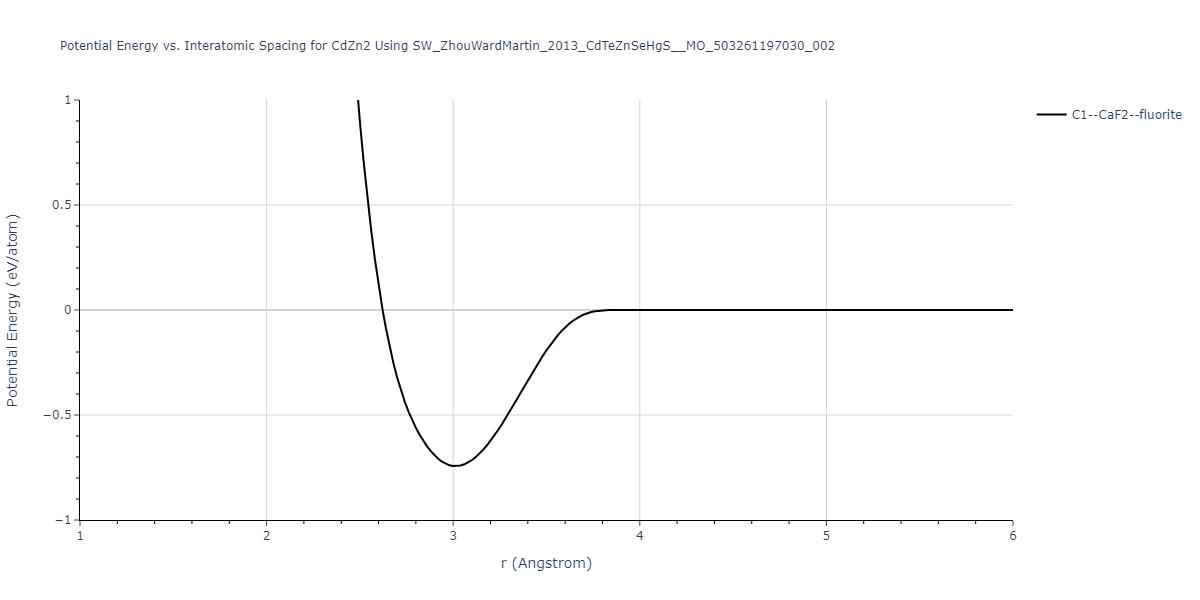
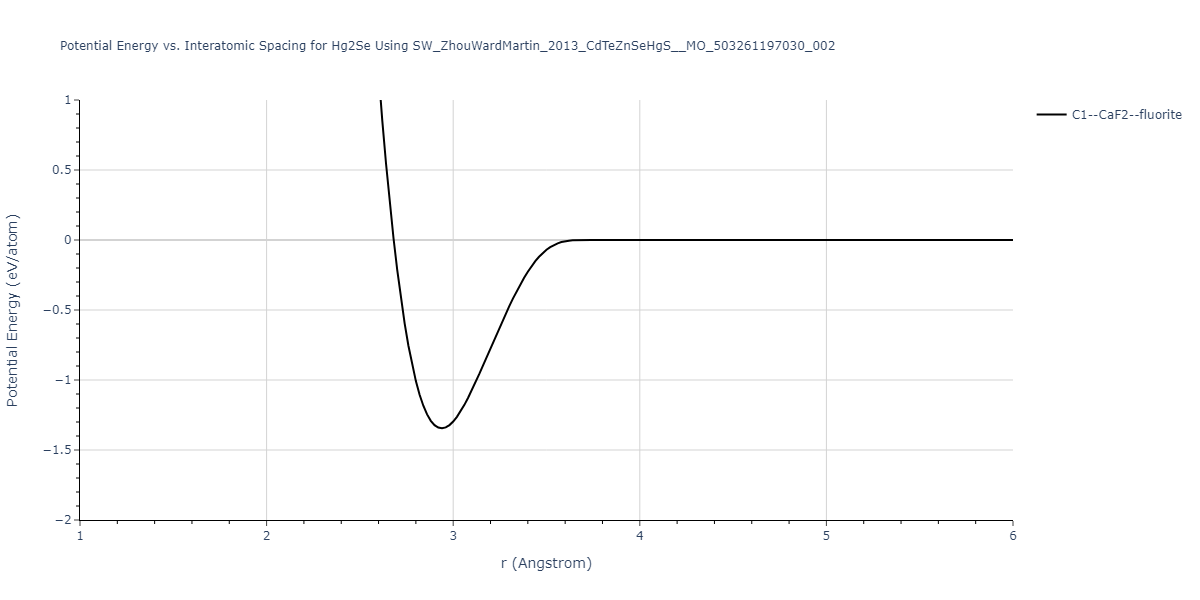
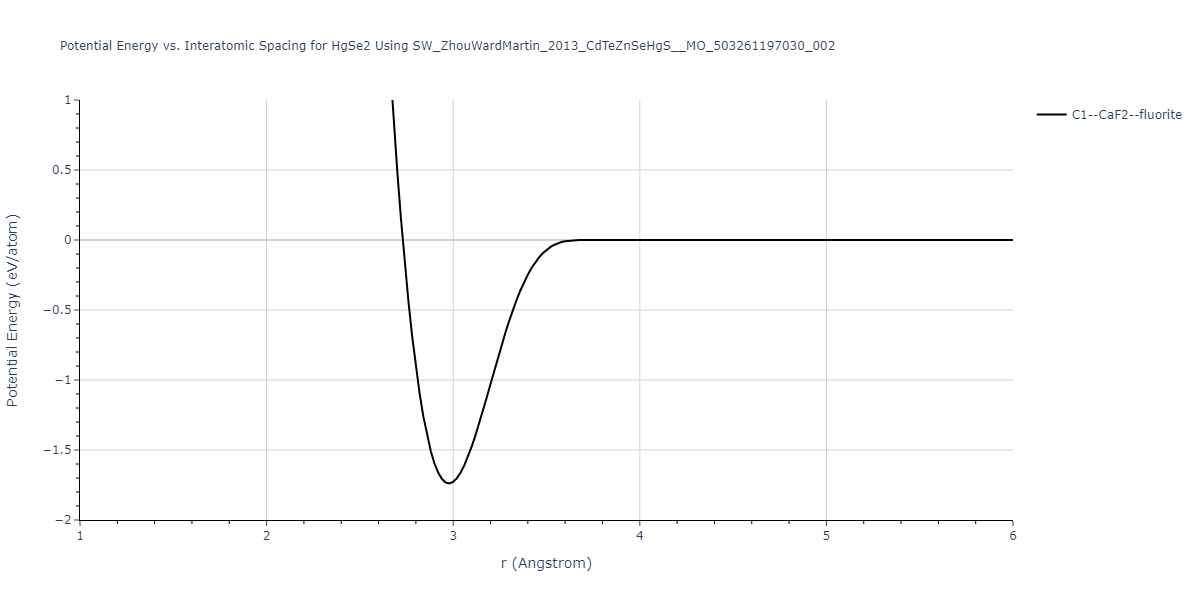
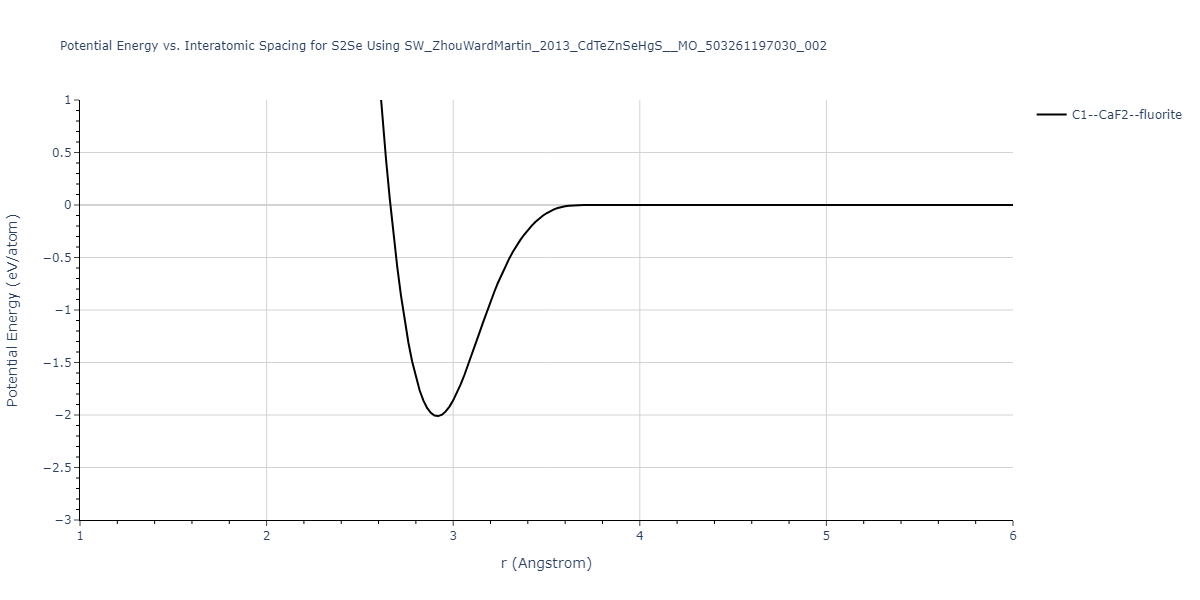
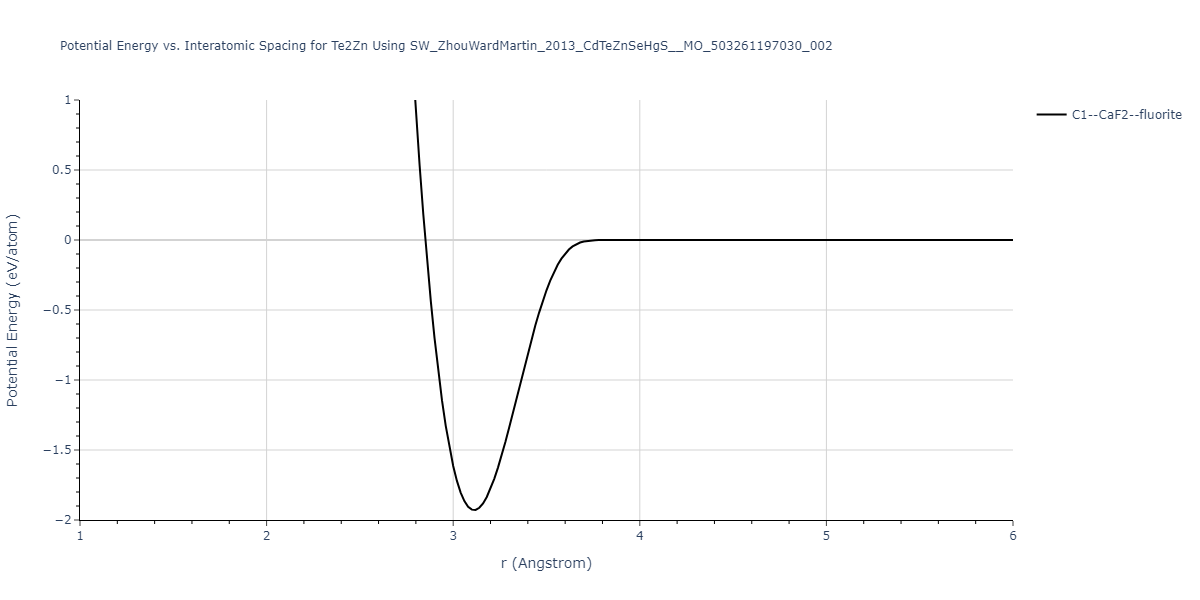
| C1--CaF2--fluorite | static | -0.6791 | -0.6791 | 6.7418 | 6.7418 | 6.7418 | 90.0 | 90.0 | 90.0 |
Download raw data (including filtered results)
Reference structure matches:
| prototype | method | Ecoh (eV/atom) | Epot (eV/atom) | a0 (Å) | b0 (Å) | c0 (Å) | α (degrees) | β (degrees) | γ (degrees) |
|---|
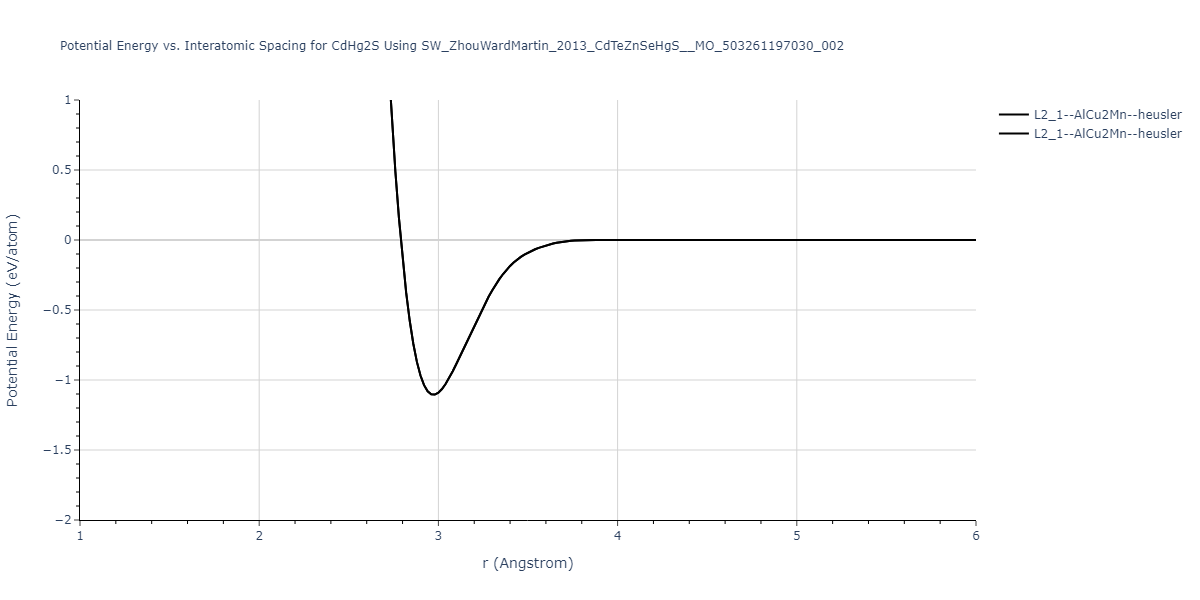
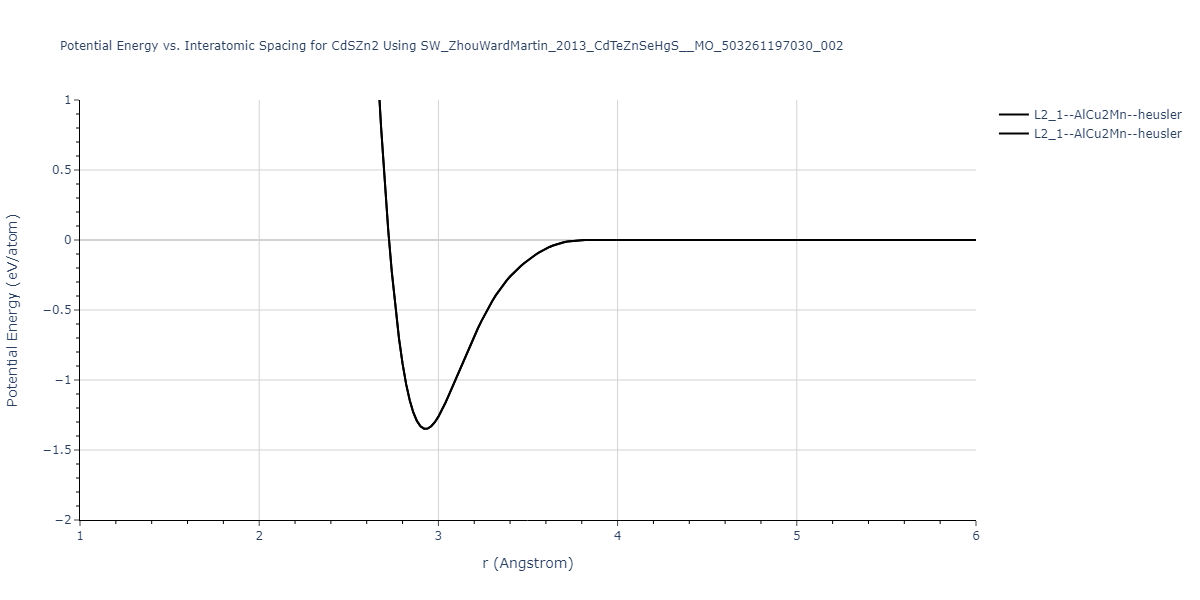
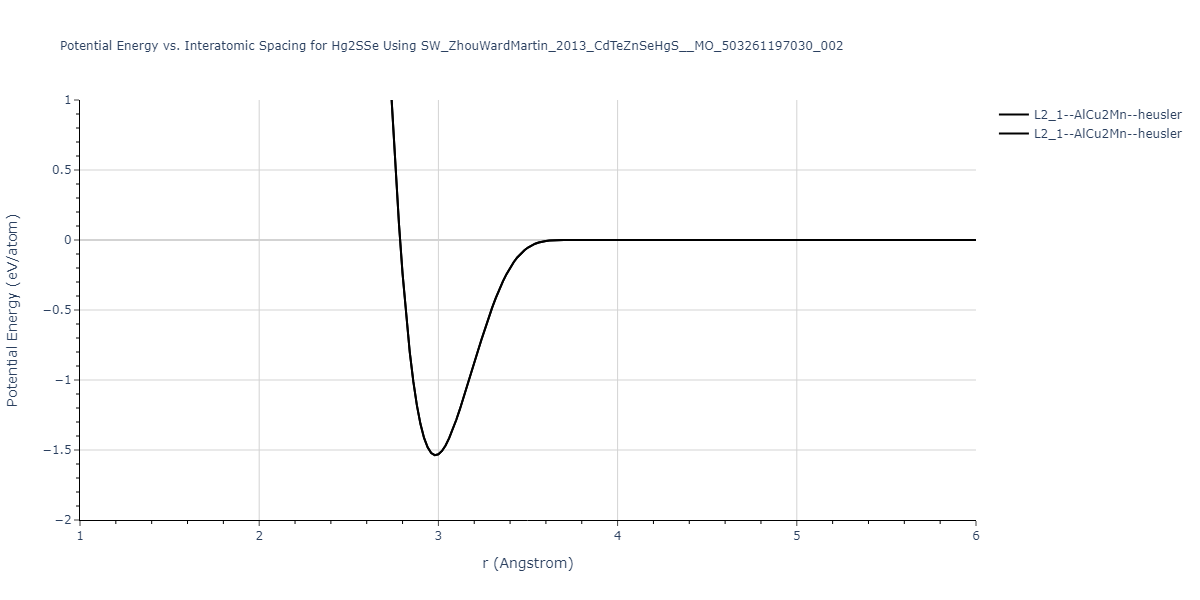
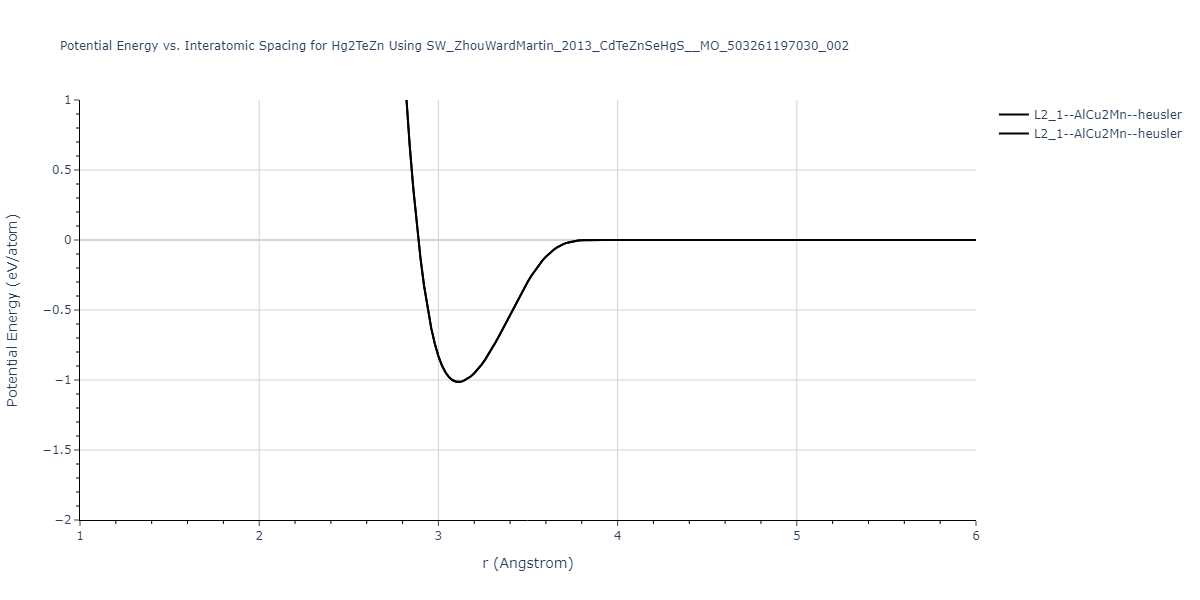
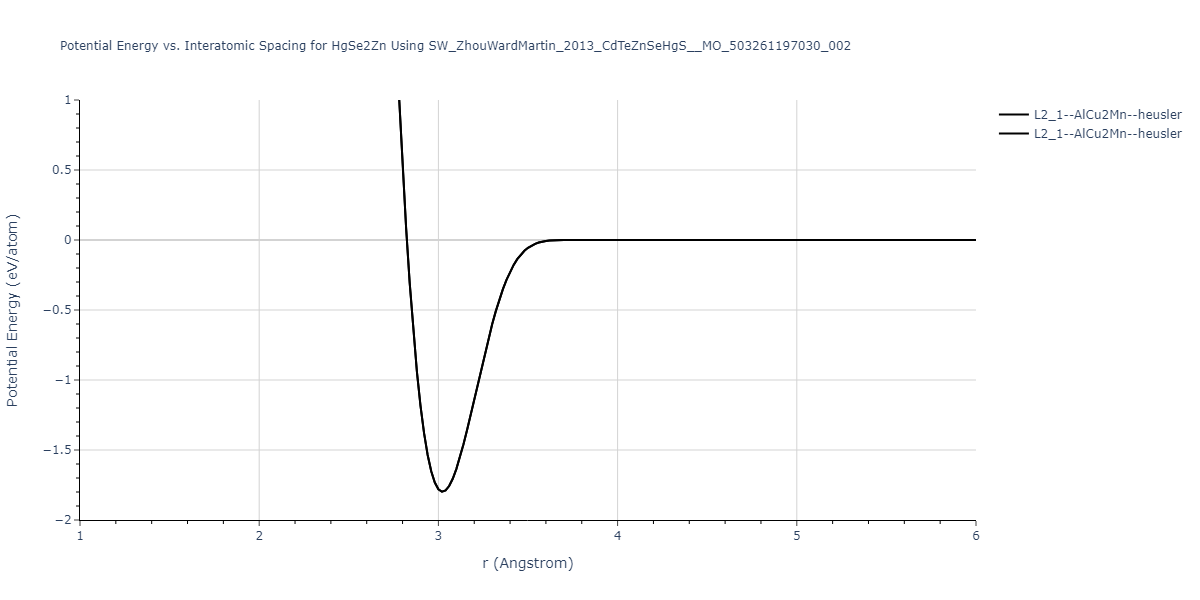
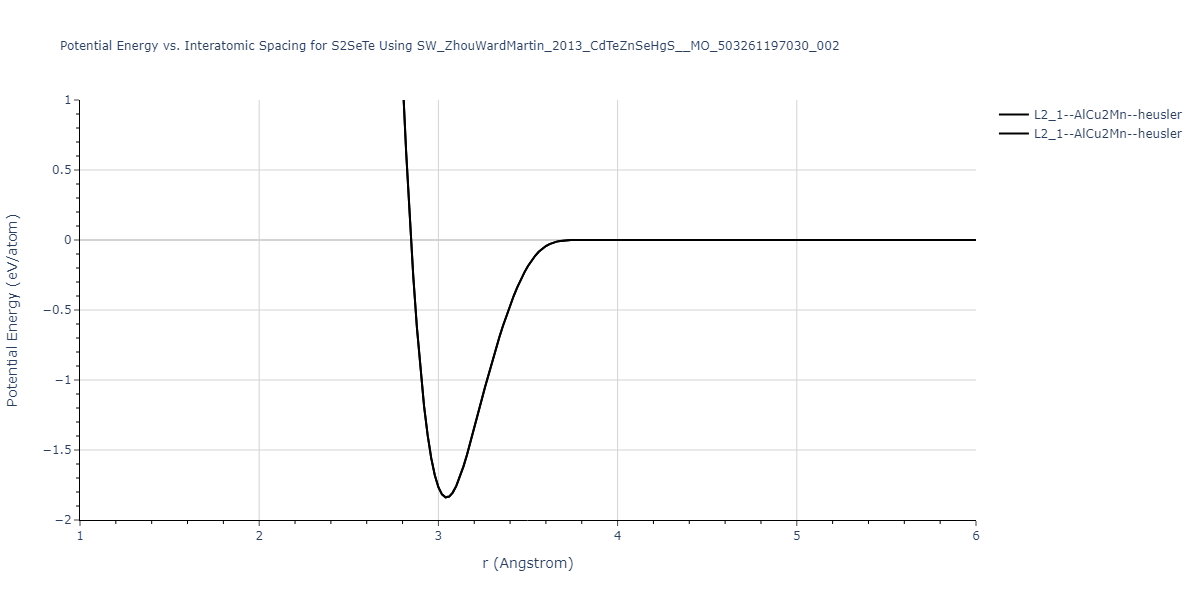
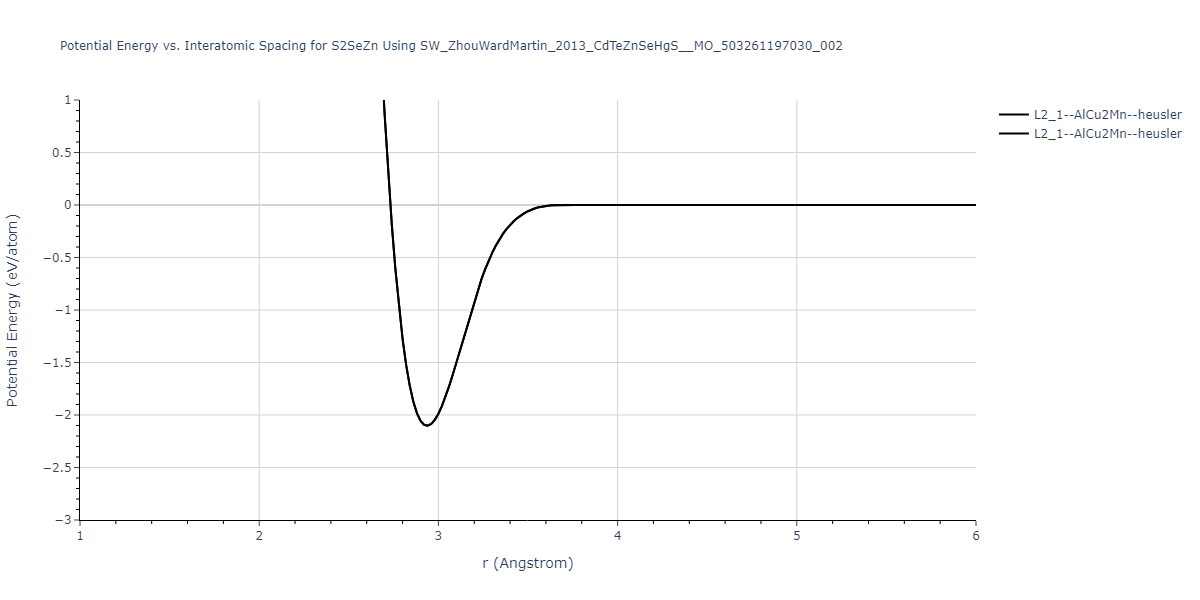
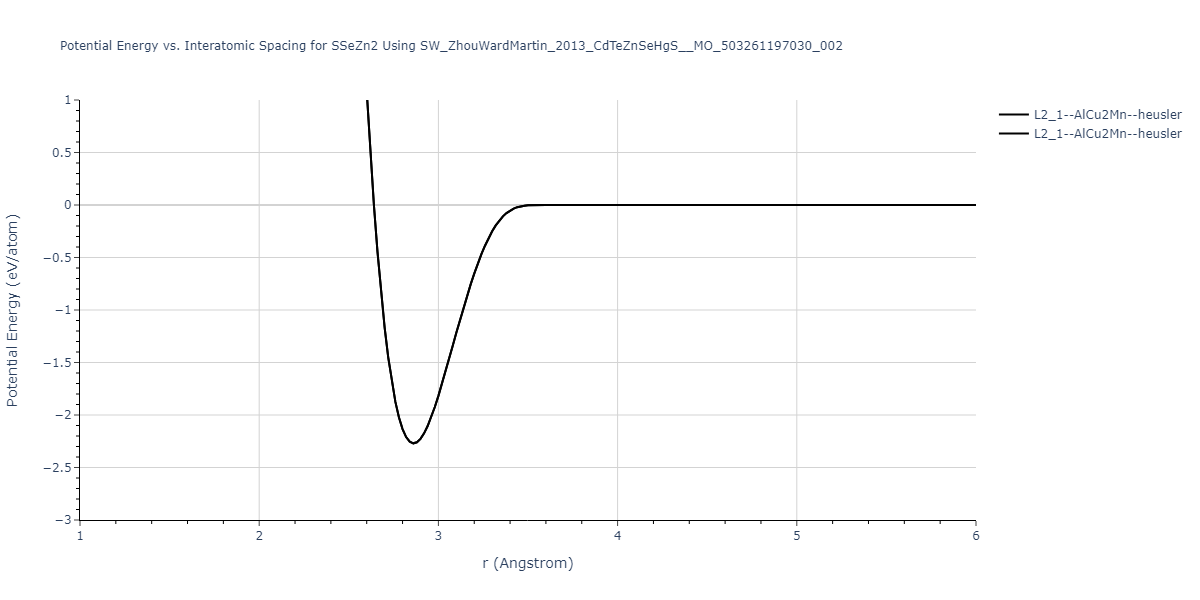
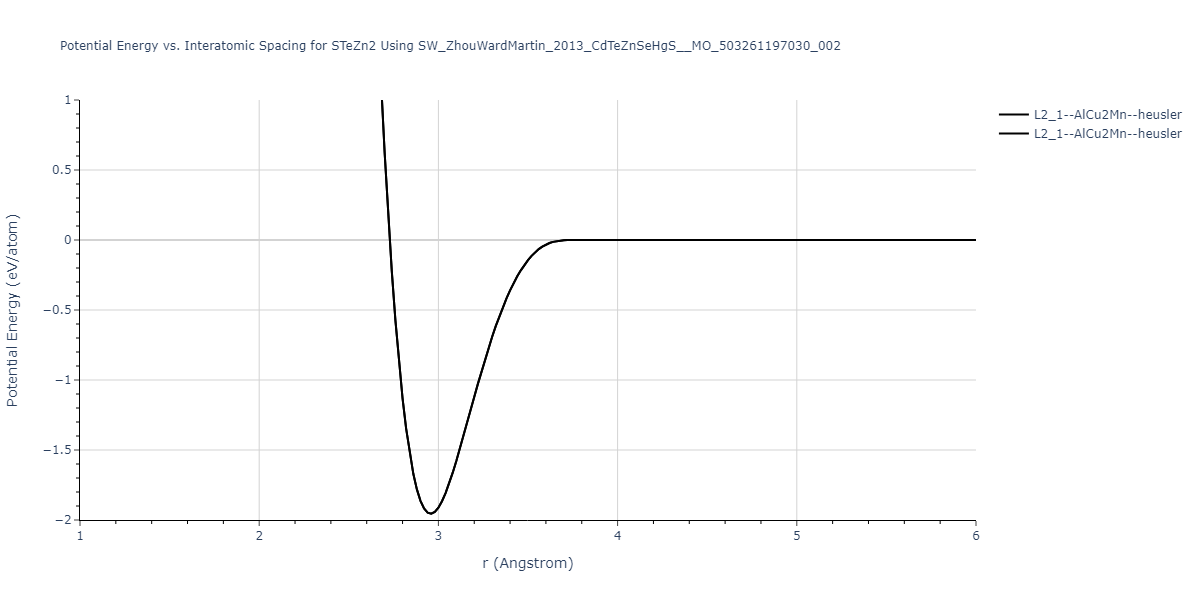
| L2_1--AlCu2Mn--heusler | static | -1.2523 | -1.2523 | 7.0555 | 7.0555 | 7.0555 | 90.0 | 90.0 | 90.0 |
Download raw data (including filtered results)
Reference structure matches:
| prototype | method | Ecoh (eV/atom) | Epot (eV/atom) | a0 (Å) | b0 (Å) | c0 (Å) | α (degrees) | β (degrees) | γ (degrees) |
|---|
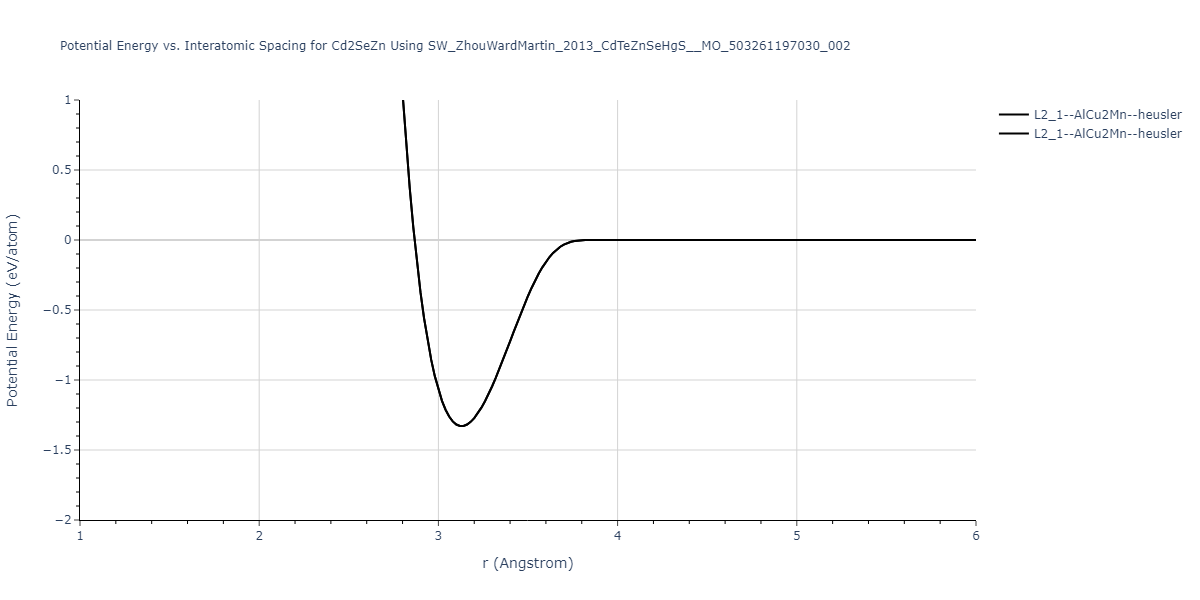
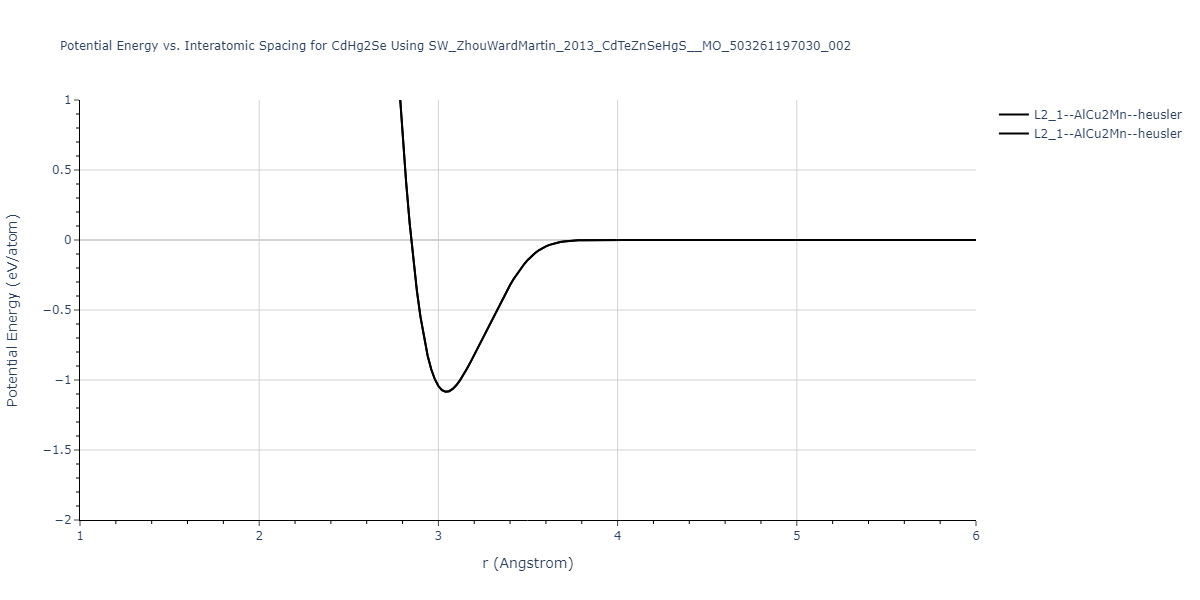
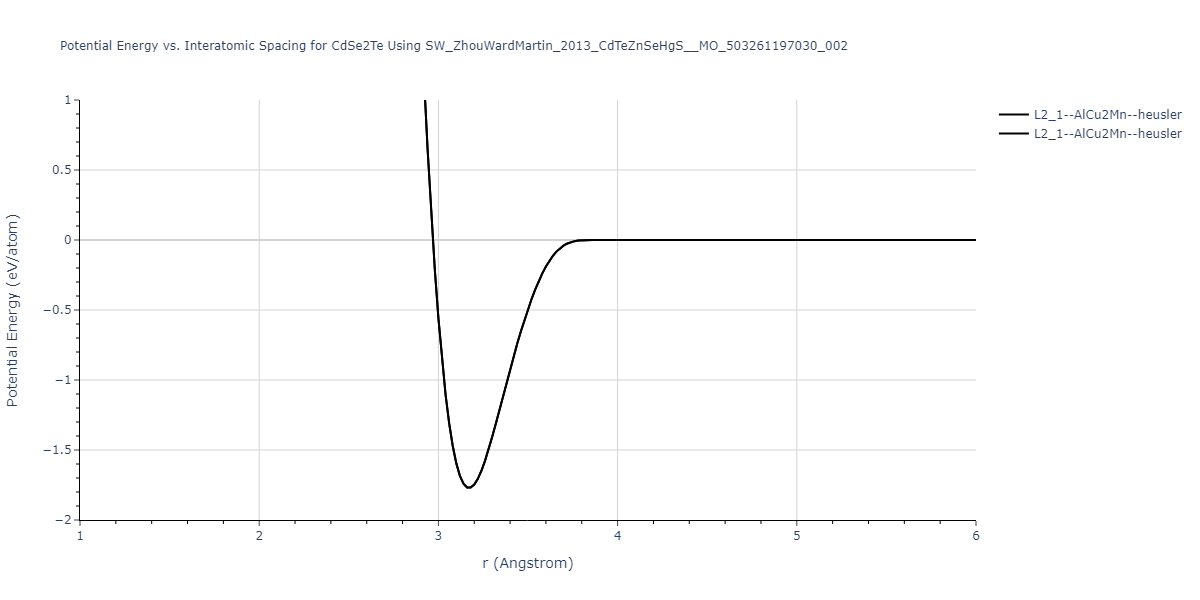
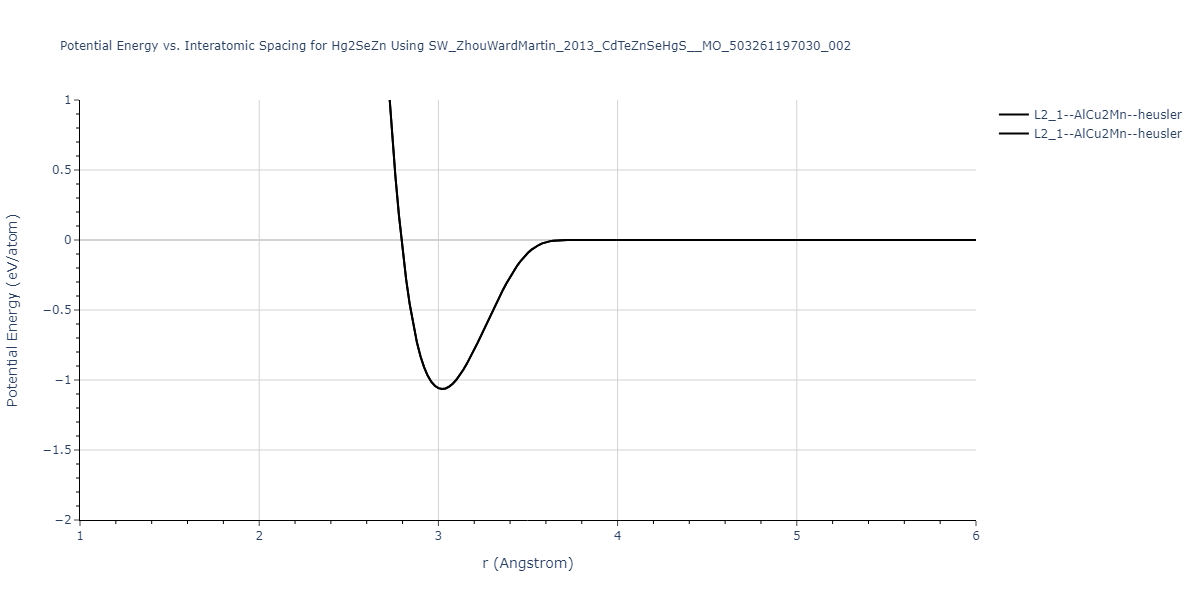
| L2_1--AlCu2Mn--heusler | static | -1.2844 | -1.2844 | 7.1485 | 7.1485 | 7.1485 | 90.0 | 90.0 | 90.0 |
Download raw data (including filtered results)
Reference structure matches:
| prototype | method | Ecoh (eV/atom) | Epot (eV/atom) | a0 (Å) | b0 (Å) | c0 (Å) | α (degrees) | β (degrees) | γ (degrees) |
|---|
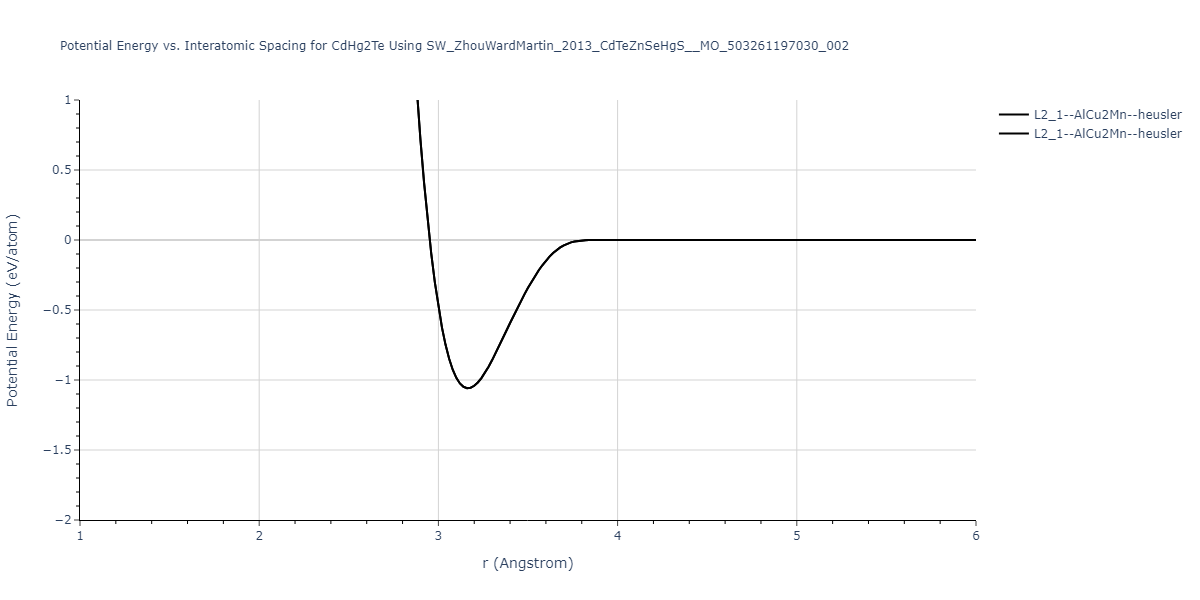
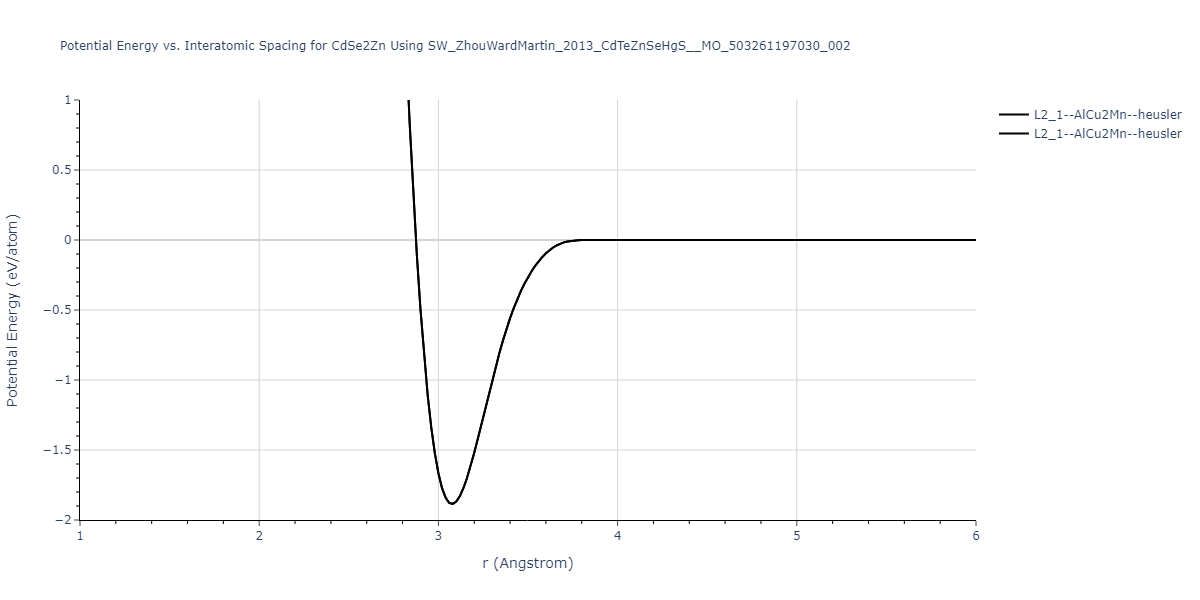
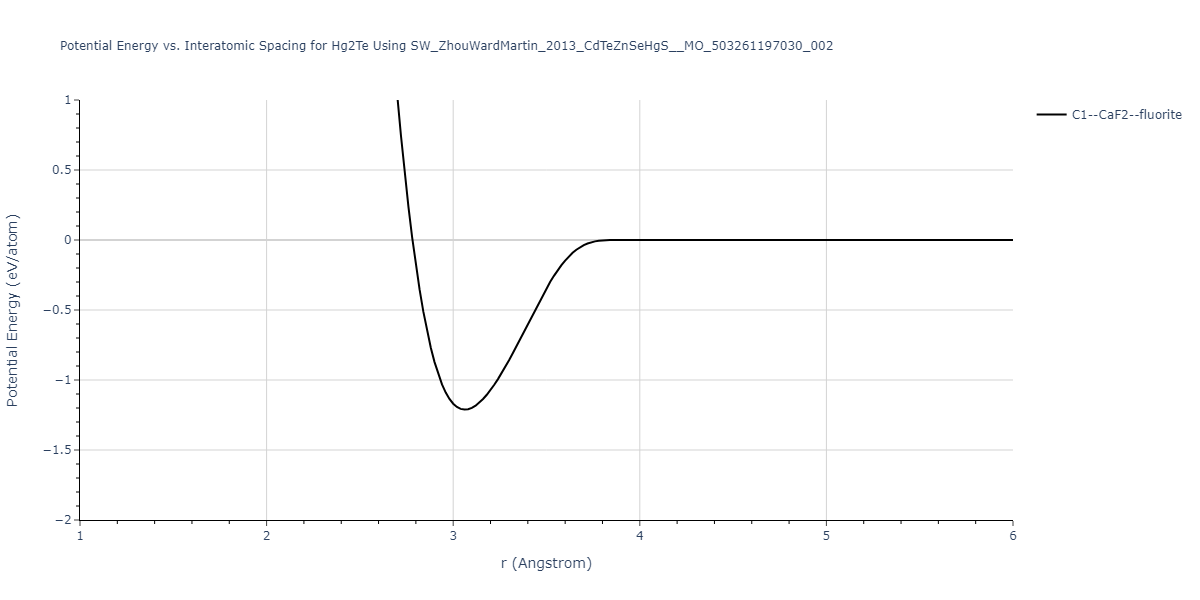
| L2_1--AlCu2Mn--heusler | static | -1.265 | -1.265 | 7.3882 | 7.3882 | 7.3882 | 90.0 | 90.0 | 90.0 |
Download raw data (including filtered results)
Reference structure matches:
| prototype | method | Ecoh (eV/atom) | Epot (eV/atom) | a0 (Å) | b0 (Å) | c0 (Å) | α (degrees) | β (degrees) | γ (degrees) |
|---|
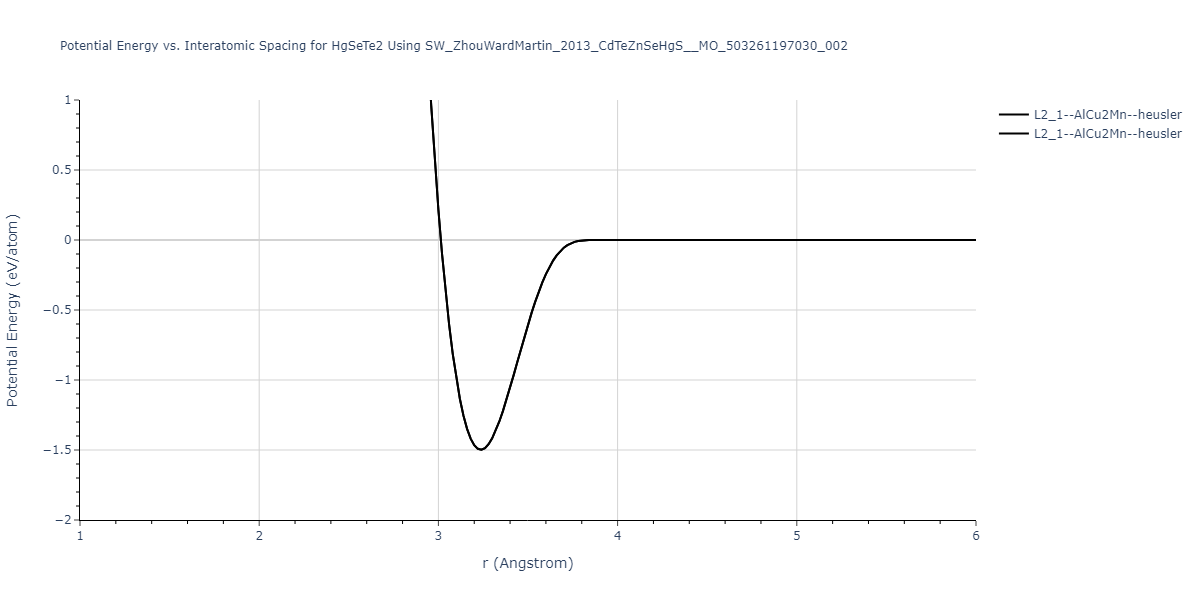
| L2_1--AlCu2Mn--heusler | static | -0.7221 | -0.7221 | 7.1776 | 7.1776 | 7.1776 | 90.0 | 90.0 | 90.0 |
Download raw data (including filtered results)
Reference structure matches:
| prototype | method | Ecoh (eV/atom) | Epot (eV/atom) | a0 (Å) | b0 (Å) | c0 (Å) | α (degrees) | β (degrees) | γ (degrees) |
|---|
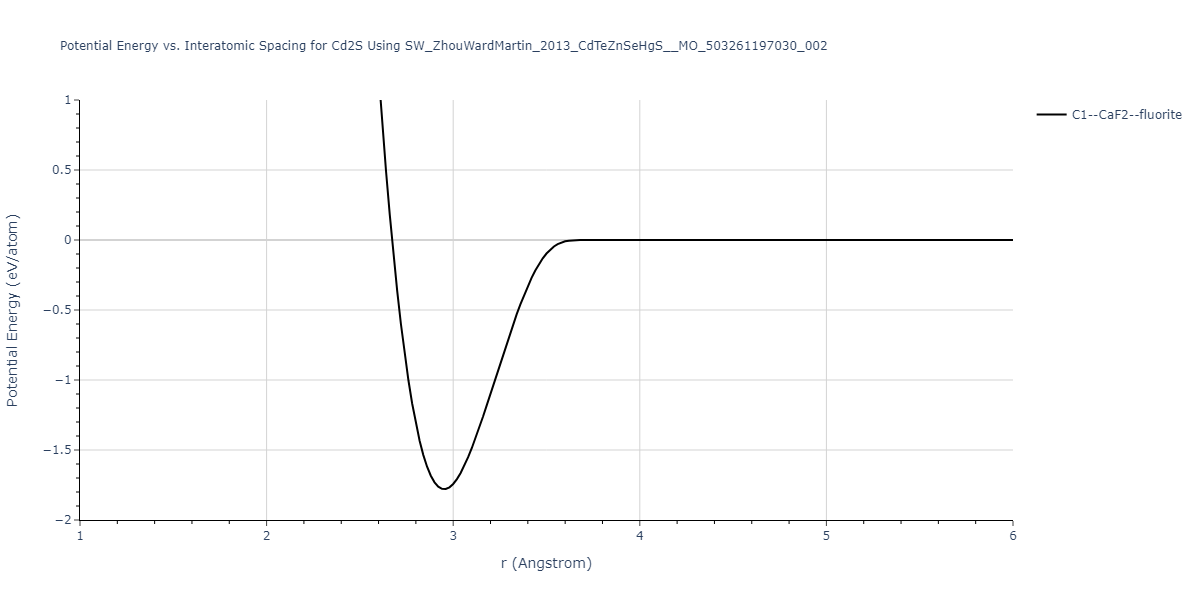
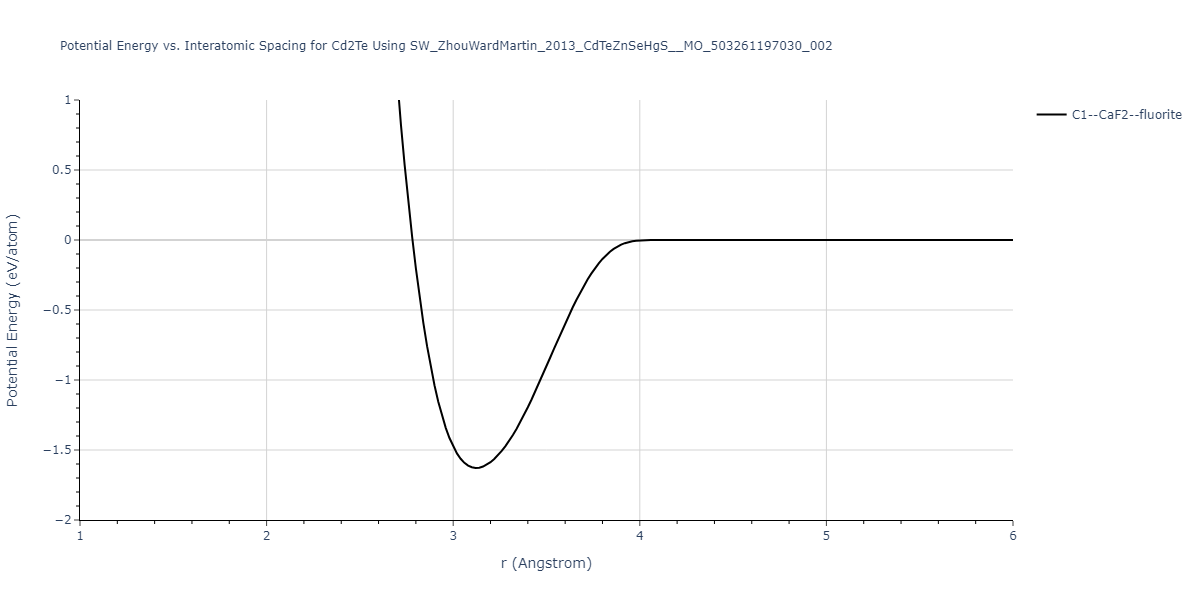
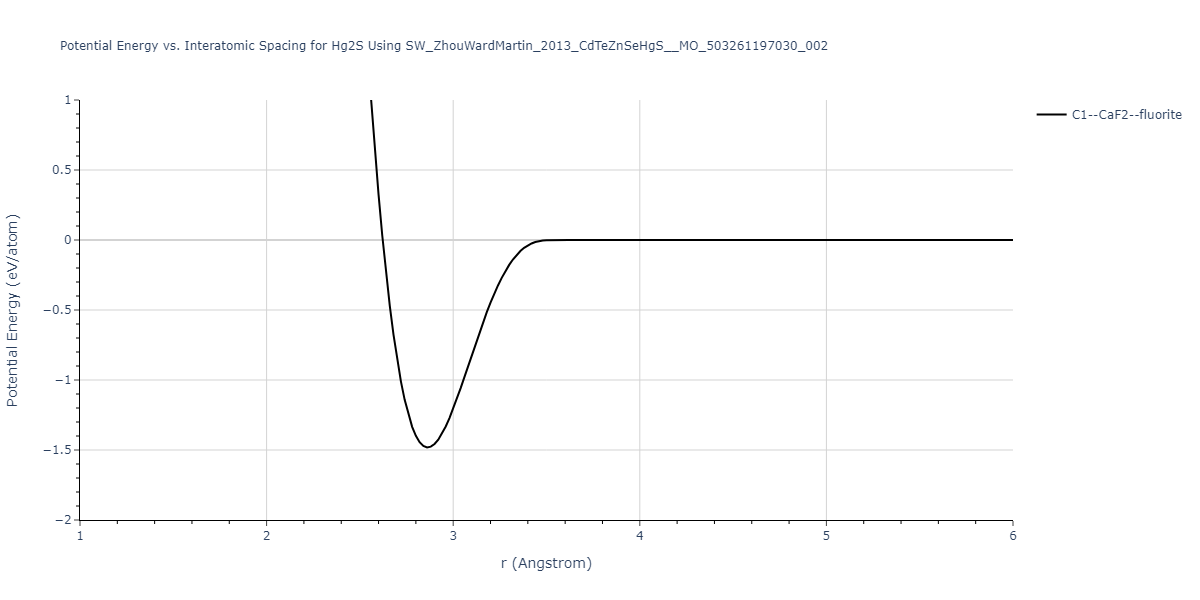
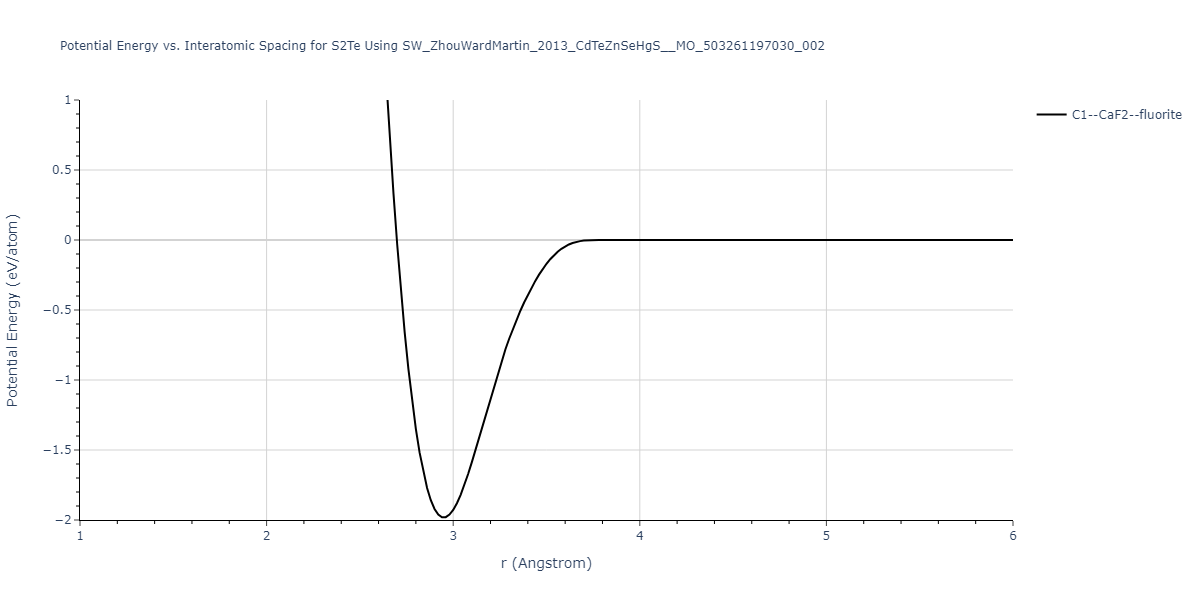
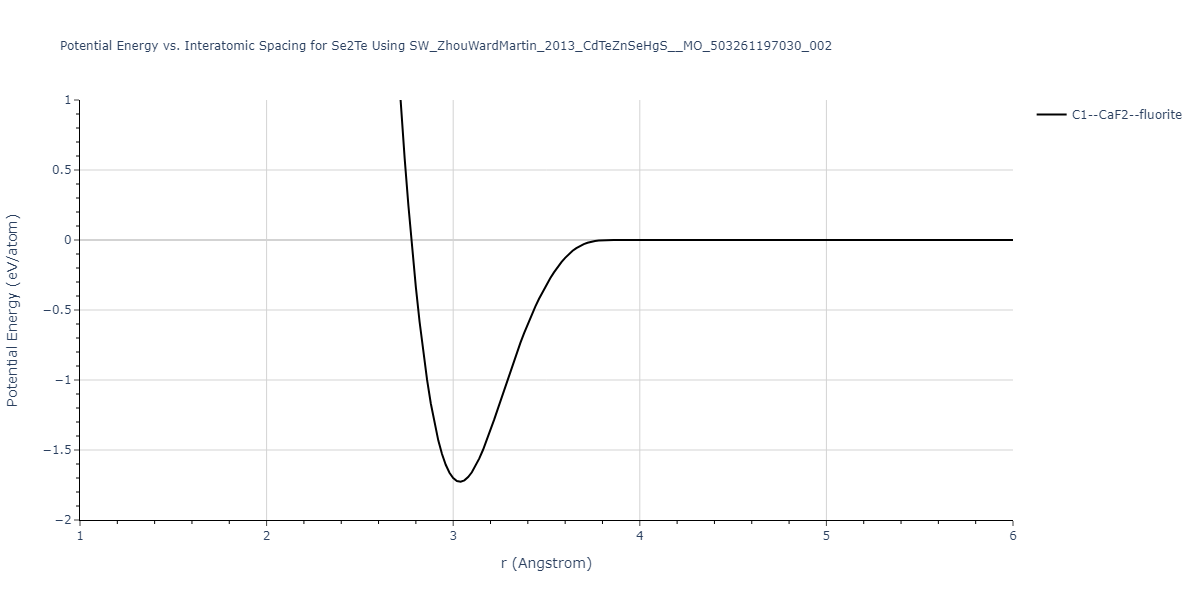
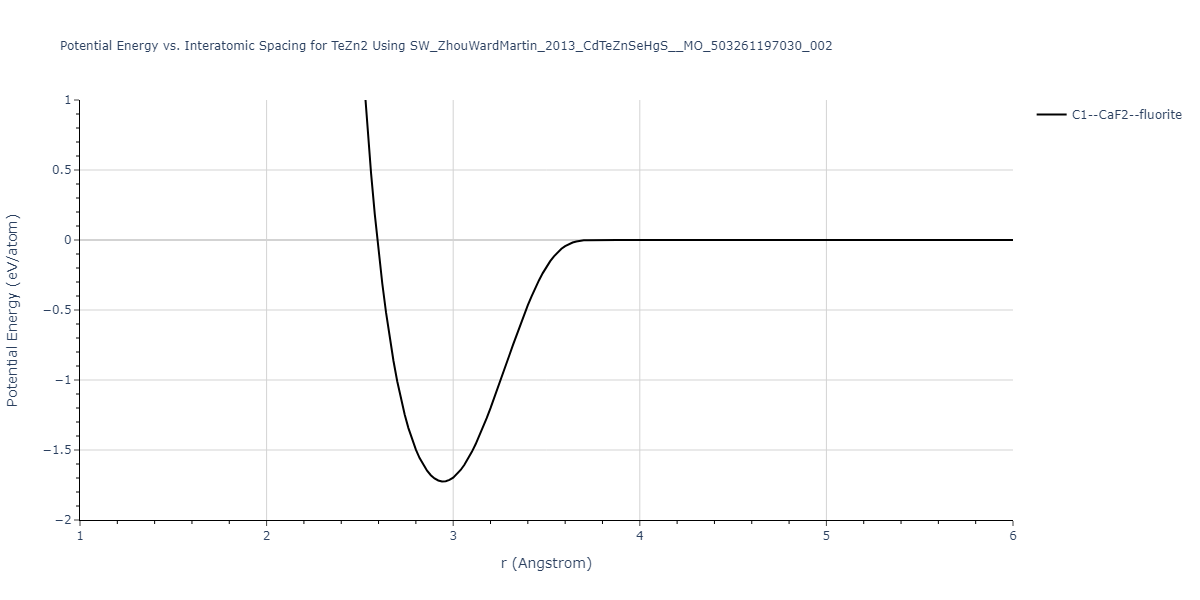
| C1--CaF2--fluorite | static | -1.7795 | -1.7795 | 6.8166 | 6.8166 | 6.8166 | 90.0 | 90.0 | 90.0 |
Download raw data (including filtered results)
Reference structure matches:
| prototype | method | Ecoh (eV/atom) | Epot (eV/atom) | a0 (Å) | b0 (Å) | c0 (Å) | α (degrees) | β (degrees) | γ (degrees) |
|---|
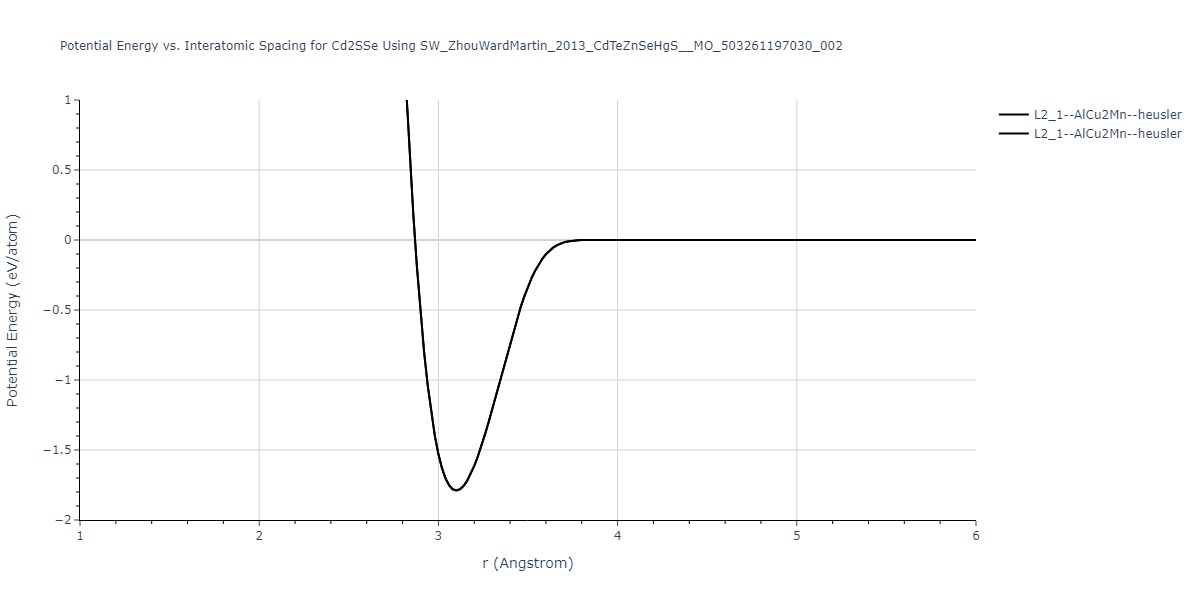
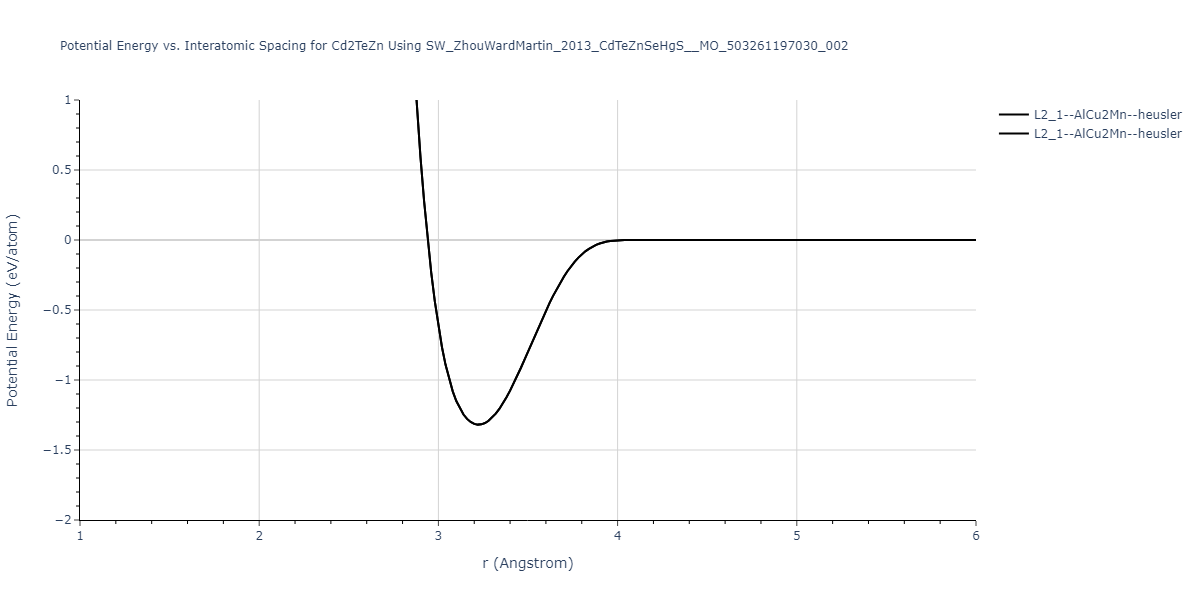
| L2_1--AlCu2Mn--heusler | static | -1.789 | -1.789 | 7.1585 | 7.1585 | 7.1585 | 90.0 | 90.0 | 90.0 |
Download raw data (including filtered results)
Reference structure matches:
| prototype | method | Ecoh (eV/atom) | Epot (eV/atom) | a0 (Å) | b0 (Å) | c0 (Å) | α (degrees) | β (degrees) | γ (degrees) |
|---|
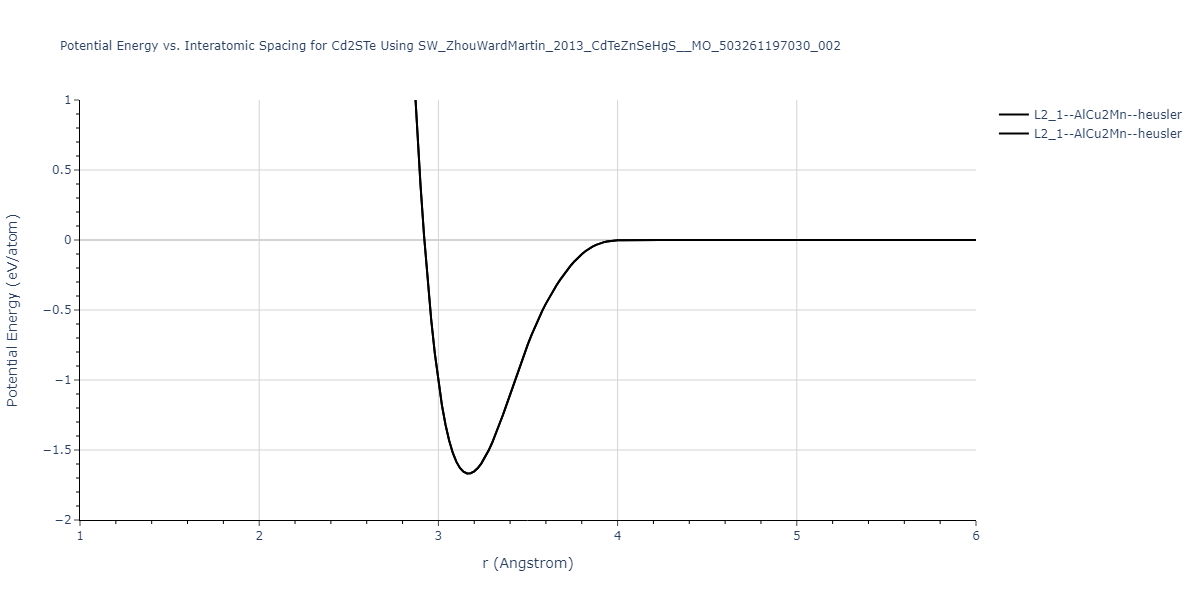
| L2_1--AlCu2Mn--heusler | static | -1.668 | -1.668 | 7.3155 | 7.3155 | 7.3155 | 90.0 | 90.0 | 90.0 |
Download raw data (including filtered results)
Reference structure matches:
| prototype | method | Ecoh (eV/atom) | Epot (eV/atom) | a0 (Å) | b0 (Å) | c0 (Å) | α (degrees) | β (degrees) | γ (degrees) |
|---|
| L2_1--AlCu2Mn--heusler | static | -1.2928 | -1.2928 | 7.1289 | 7.1289 | 7.1289 | 90.0 | 90.0 | 90.0 |
Download raw data (including filtered results)
Reference structure matches:
| prototype | method | Ecoh (eV/atom) | Epot (eV/atom) | a0 (Å) | b0 (Å) | c0 (Å) | α (degrees) | β (degrees) | γ (degrees) |
|---|
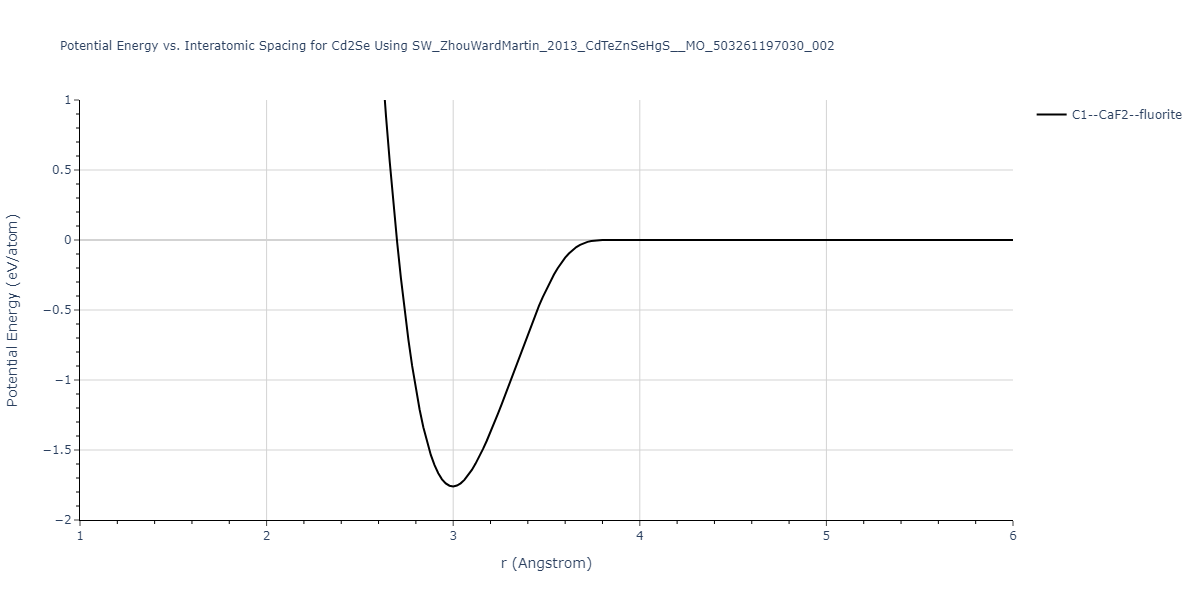
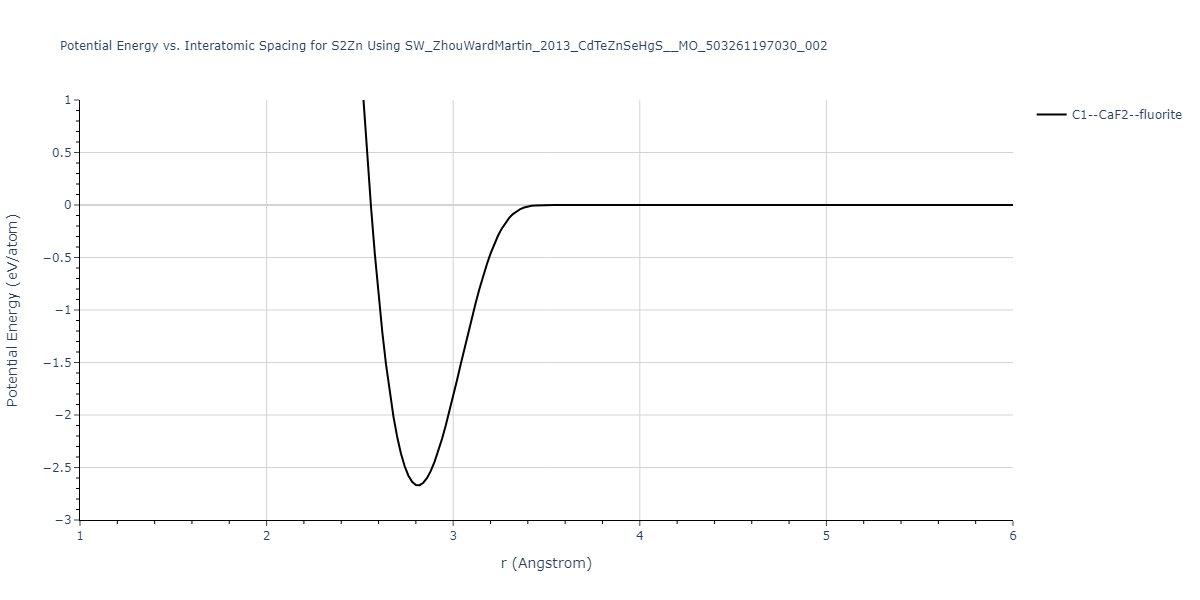
| C1--CaF2--fluorite | static | -1.76 | -1.76 | 6.9248 | 6.9248 | 6.9248 | 90.0 | 90.0 | 90.0 |
Download raw data (including filtered results)
Reference structure matches:
| prototype | method | Ecoh (eV/atom) | Epot (eV/atom) | a0 (Å) | b0 (Å) | c0 (Å) | α (degrees) | β (degrees) | γ (degrees) |
|---|
| L2_1--AlCu2Mn--heusler | static | -1.7148 | -1.7148 | 7.4063 | 7.4063 | 7.4063 | 90.0 | 90.0 | 90.0 |
Download raw data (including filtered results)
Reference structure matches:
| prototype | method | Ecoh (eV/atom) | Epot (eV/atom) | a0 (Å) | b0 (Å) | c0 (Å) | α (degrees) | β (degrees) | γ (degrees) |
|---|
| L2_1--AlCu2Mn--heusler | static | -1.3296 | -1.3296 | 7.2266 | 7.2266 | 7.2266 | 90.0 | 90.0 | 90.0 |
Download raw data (including filtered results)
Reference structure matches:
| prototype | method | Ecoh (eV/atom) | Epot (eV/atom) | a0 (Å) | b0 (Å) | c0 (Å) | α (degrees) | β (degrees) | γ (degrees) |
|---|
| C1--CaF2--fluorite | static | -1.6281 | -1.6281 | 7.2141 | 7.2141 | 7.2141 | 90.0 | 90.0 | 90.0 |
| oqmd-1232276 | box | -1.4657 | -1.4657 | 7.0115 | 7.0115 | 4.6799 | 90.0 | 90.0 | 90.0 |
Download raw data (including filtered results)
Reference structure matches:
| prototype | method | Ecoh (eV/atom) | Epot (eV/atom) | a0 (Å) | b0 (Å) | c0 (Å) | α (degrees) | β (degrees) | γ (degrees) |
|---|
| L2_1--AlCu2Mn--heusler | static | -1.3189 | -1.3189 | 7.4464 | 7.4464 | 7.4464 | 90.0 | 90.0 | 90.0 |
Download raw data (including filtered results)
Reference structure matches:
| prototype | method | Ecoh (eV/atom) | Epot (eV/atom) | a0 (Å) | b0 (Å) | c0 (Å) | α (degrees) | β (degrees) | γ (degrees) |
|---|
| C1--CaF2--fluorite | static | -0.8266 | -0.8266 | 6.9031 | 6.9031 | 6.9031 | 90.0 | 90.0 | 90.0 |
Download raw data (including filtered results)
Reference structure matches:
| prototype | method | Ecoh (eV/atom) | Epot (eV/atom) | a0 (Å) | b0 (Å) | c0 (Å) | α (degrees) | β (degrees) | γ (degrees) |
|---|
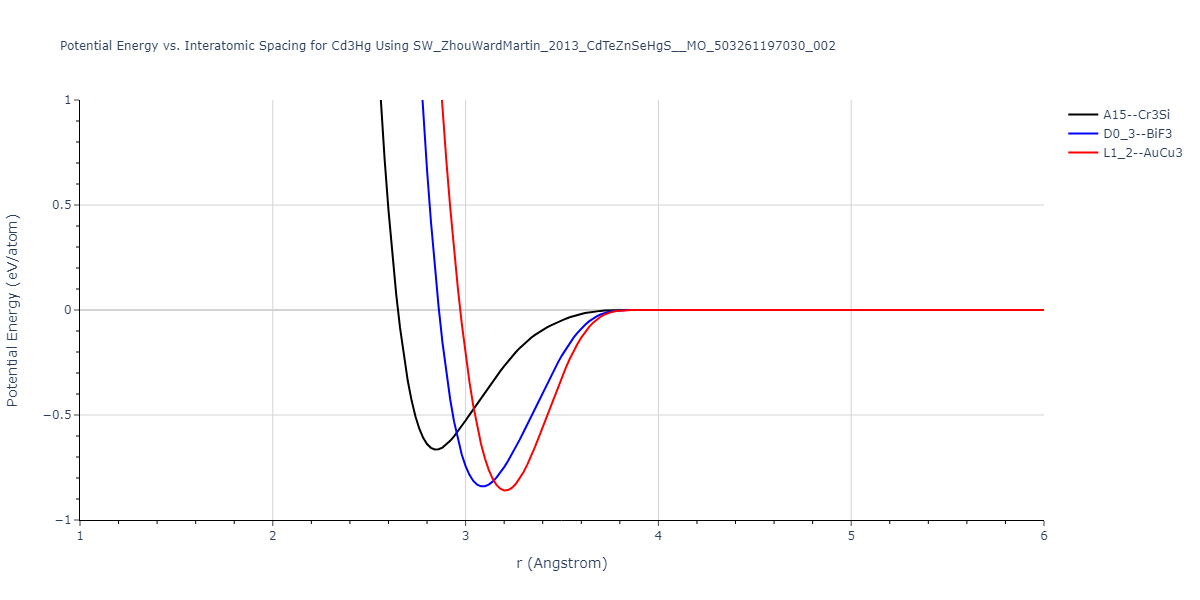
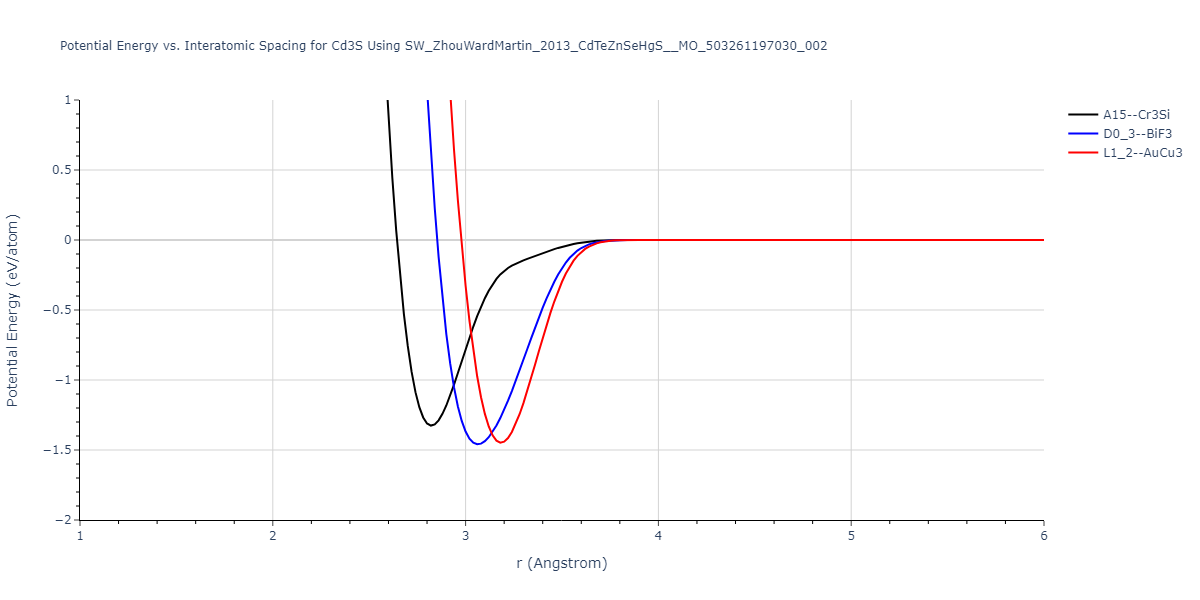
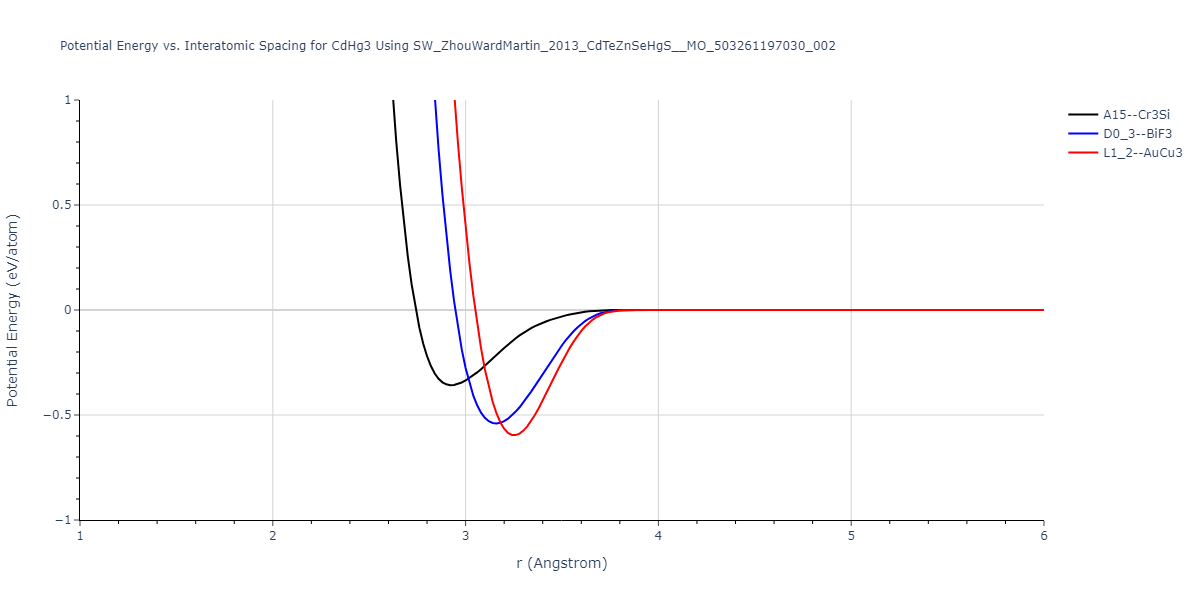
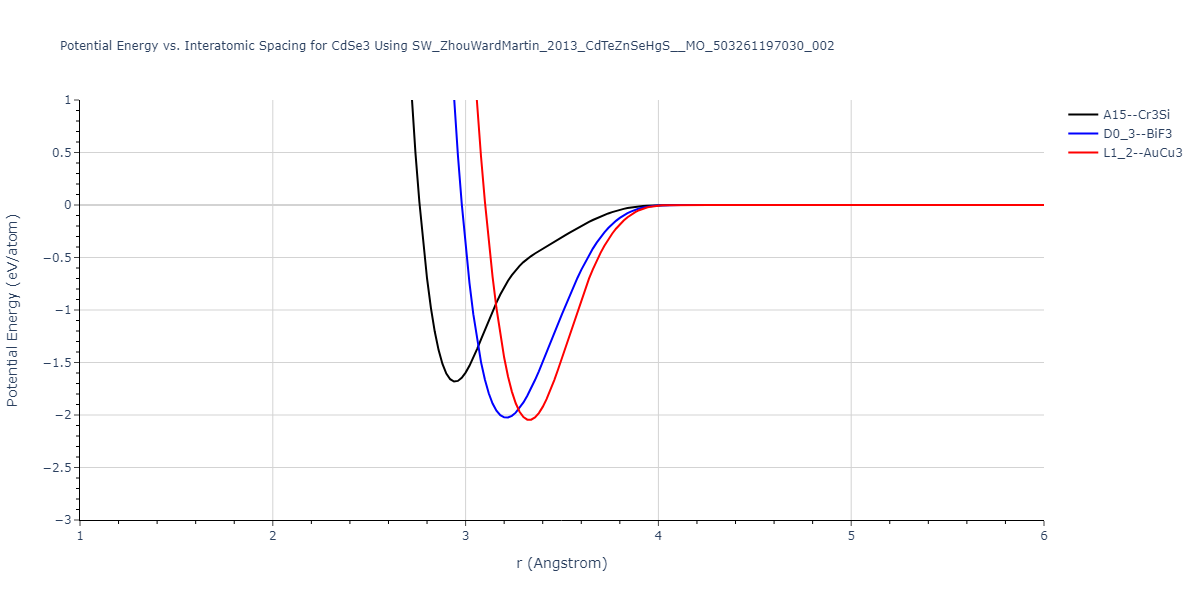
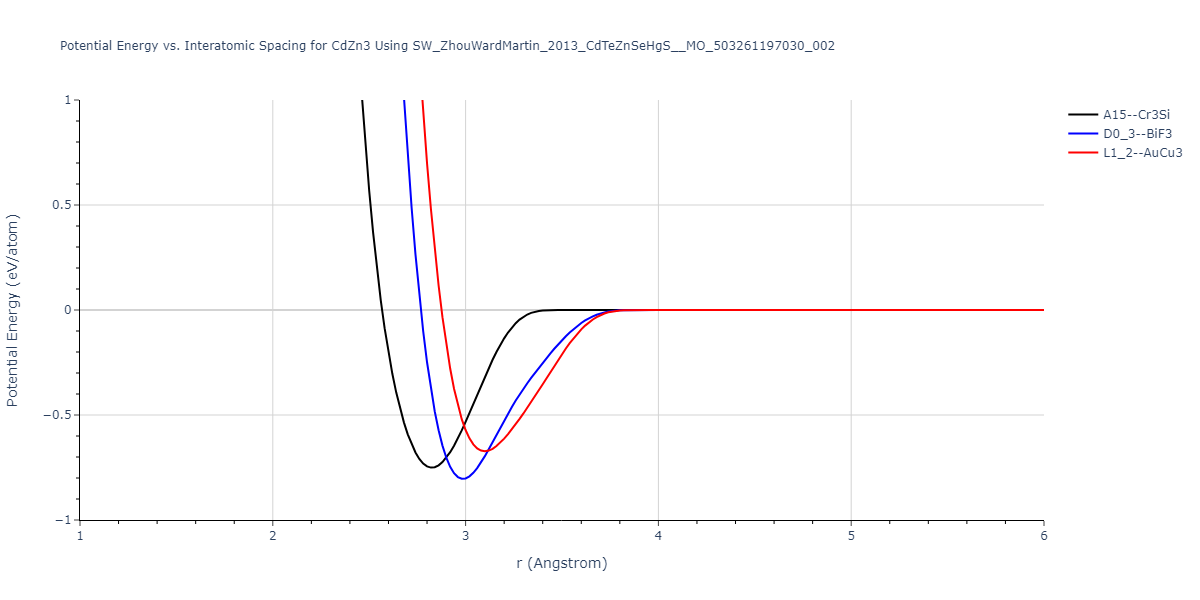
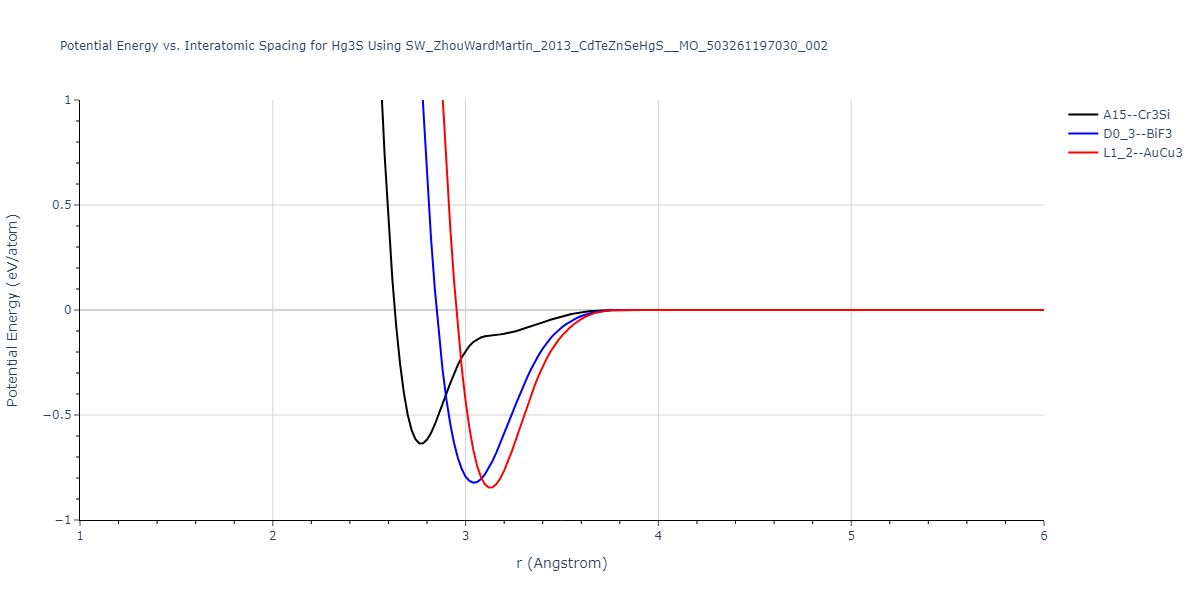
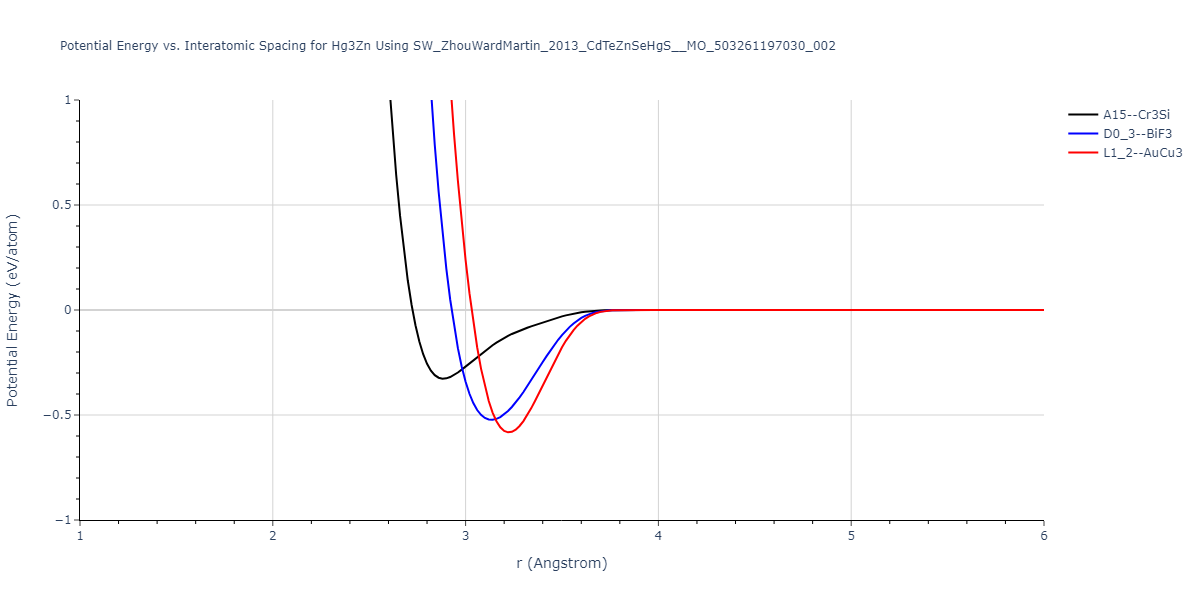
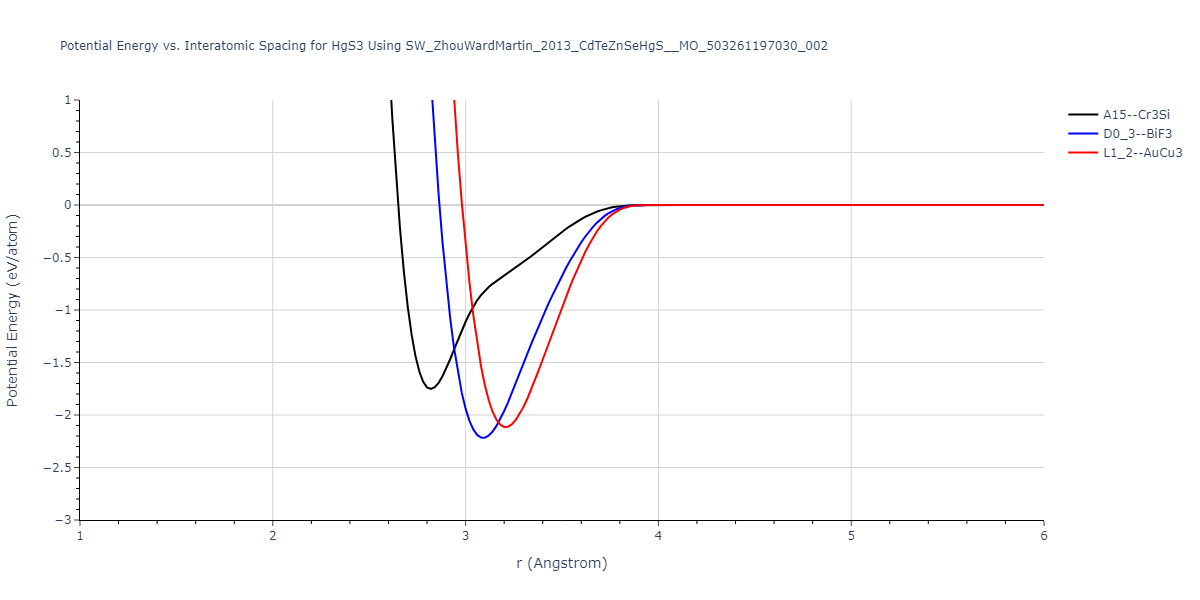
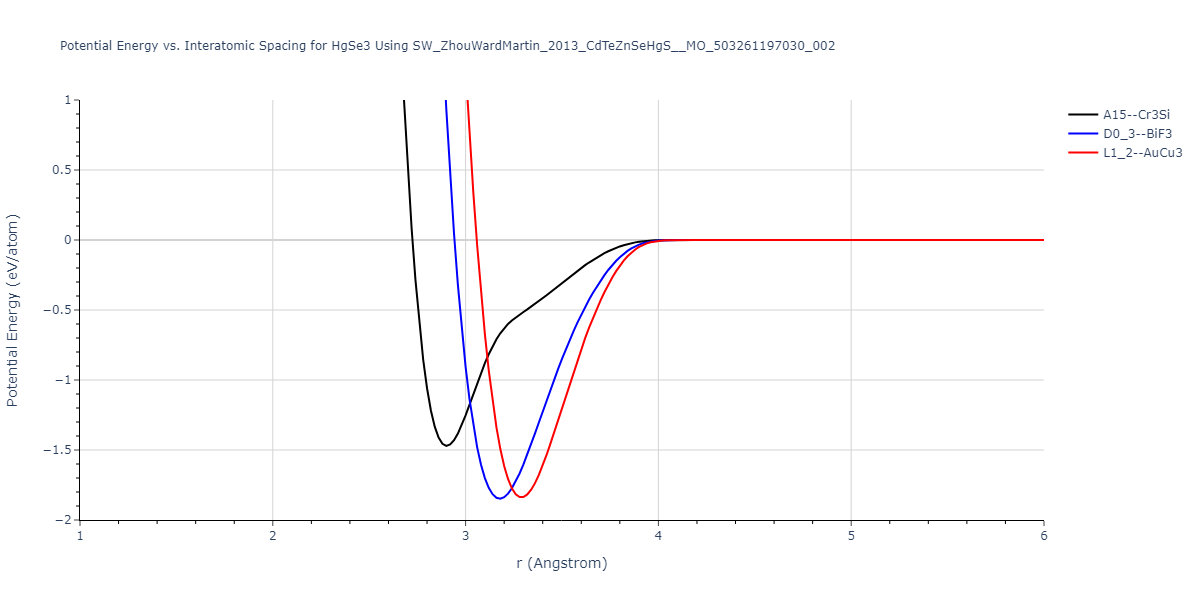
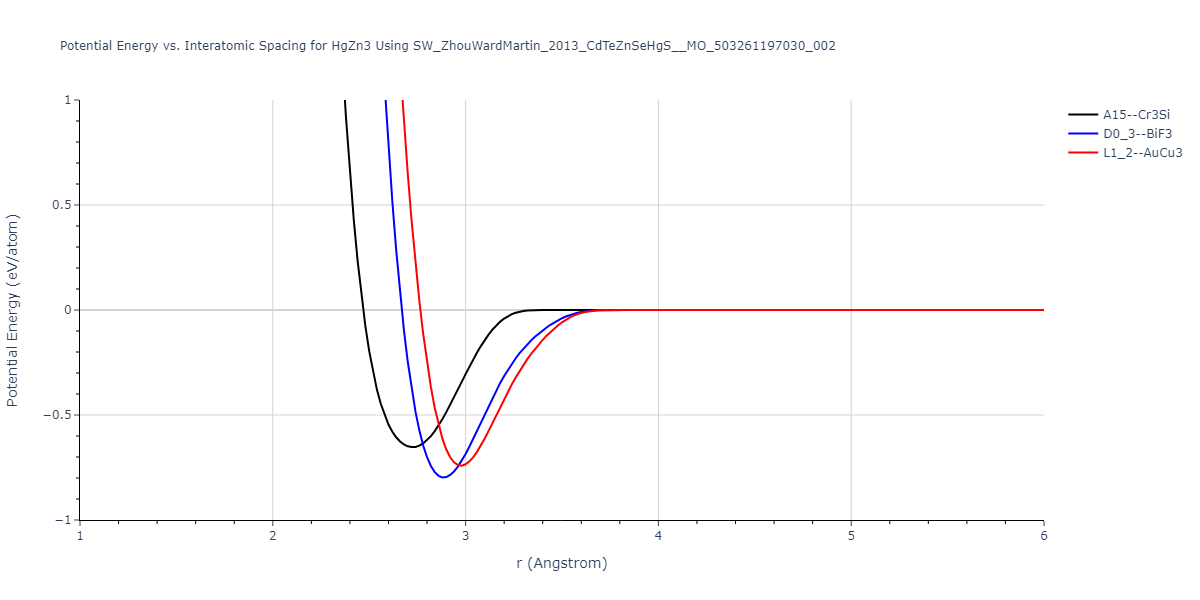
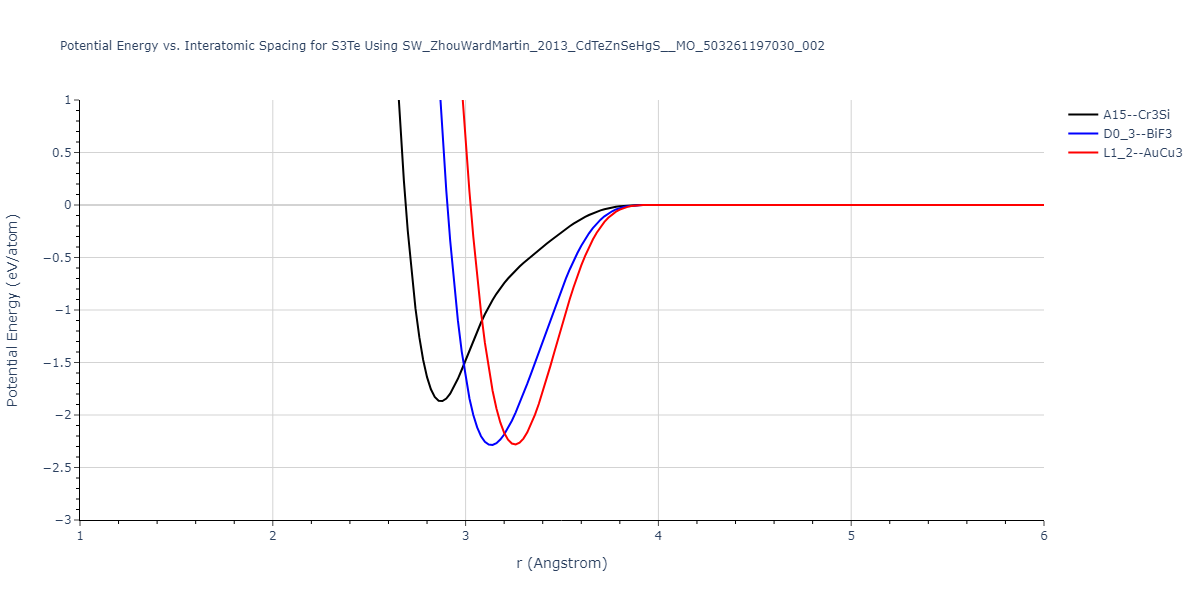
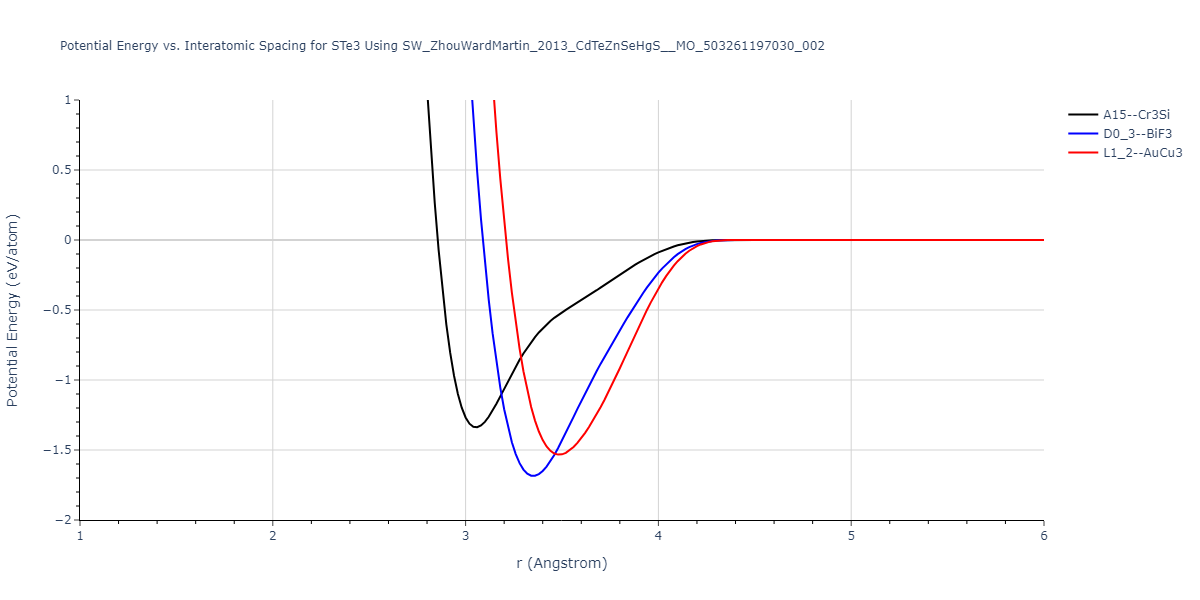
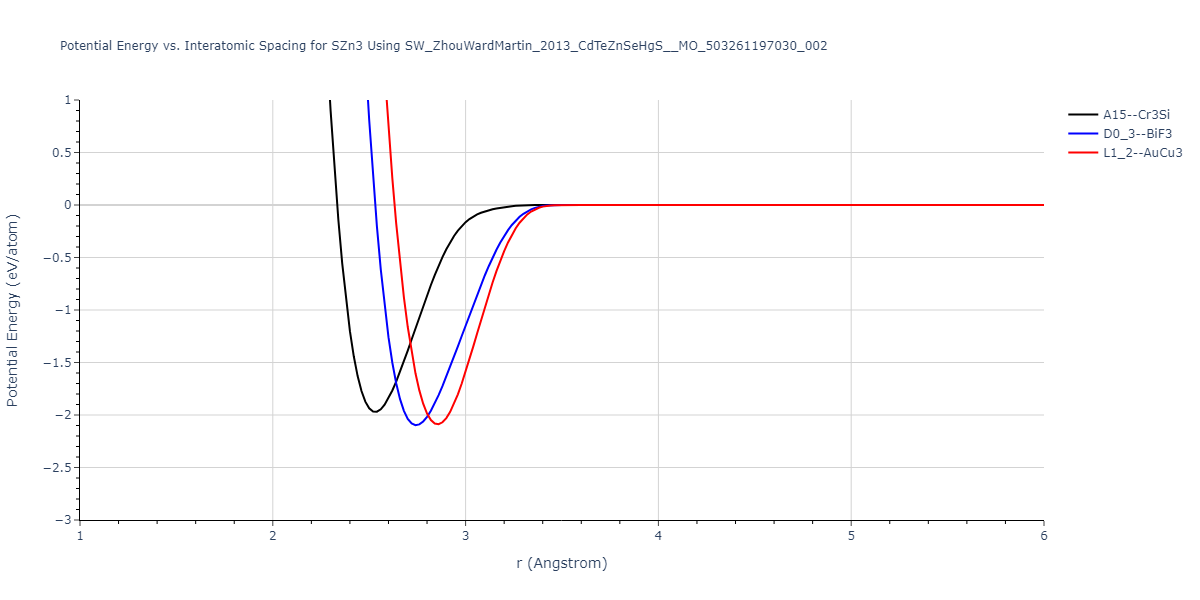
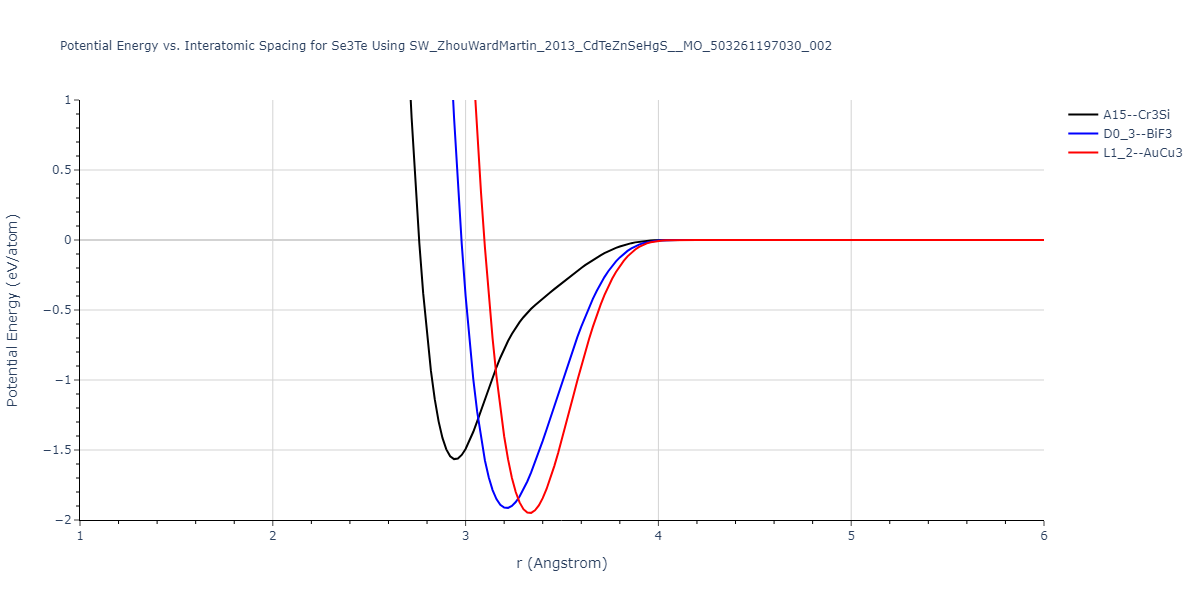
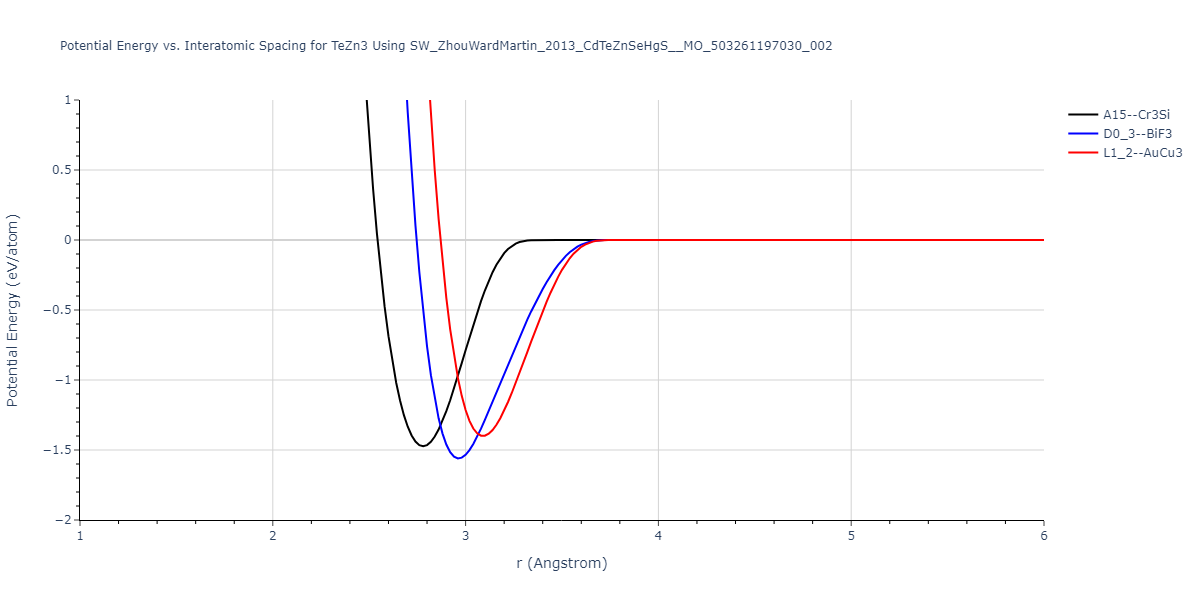
| L1_2--AuCu3 | dynamic | -0.8596 | -0.8596 | 4.5345 | 4.5345 | 4.5345 | 90.0 | 90.0 | 90.0 |
| D0_3--BiF3 | dynamic | -0.8403 | -0.8403 | 7.1327 | 7.1327 | 7.1327 | 90.0 | 90.0 | 90.0 |
| A15--Cr3Si | static | -0.6645 | -0.6645 | 5.6951 | 5.6951 | 5.6951 | 90.0 | 90.0 | 90.0 |
Download raw data (including filtered results)
Reference structure matches:
| prototype | method | Ecoh (eV/atom) | Epot (eV/atom) | a0 (Å) | b0 (Å) | c0 (Å) | α (degrees) | β (degrees) | γ (degrees) |
|---|
| D0_3--BiF3 | static | -1.4592 | -1.4592 | 7.0754 | 7.0754 | 7.0754 | 90.0 | 90.0 | 90.0 |
| L1_2--AuCu3 | box | -1.4475 | -1.4475 | 4.5017 | 4.5017 | 4.5017 | 90.0 | 90.0 | 90.0 |
| A15--Cr3Si | static | -1.3257 | -1.3257 | 5.6448 | 5.6448 | 5.6448 | 90.0 | 90.0 | 90.0 |
Download raw data (including filtered results)
Reference structure matches:
| prototype | method | Ecoh (eV/atom) | Epot (eV/atom) | a0 (Å) | b0 (Å) | c0 (Å) | α (degrees) | β (degrees) | γ (degrees) |
|---|
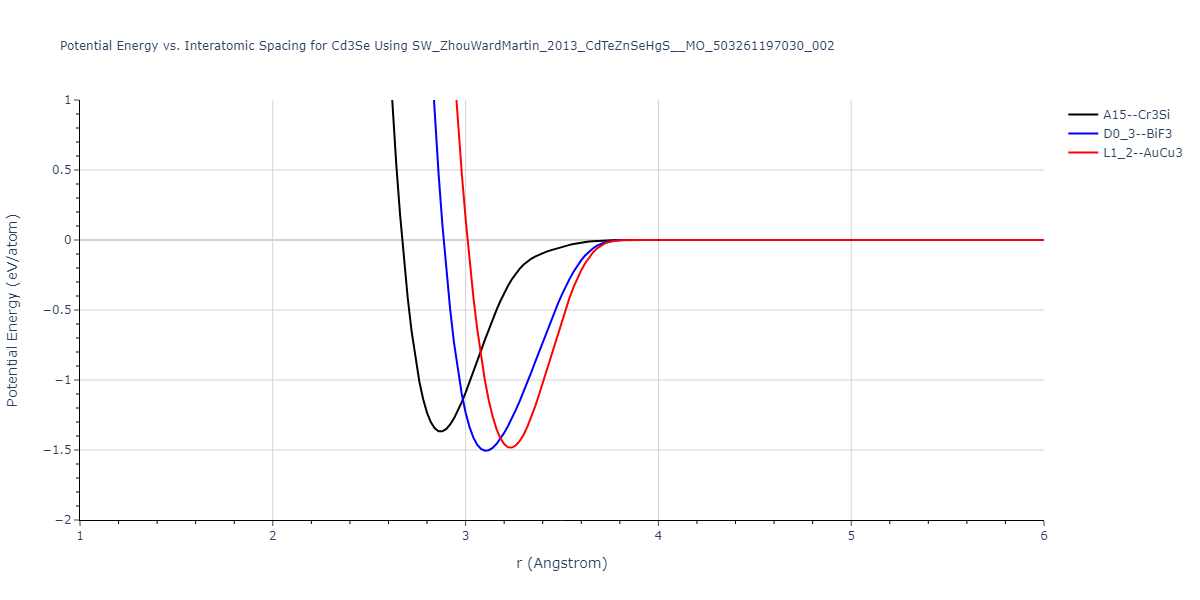
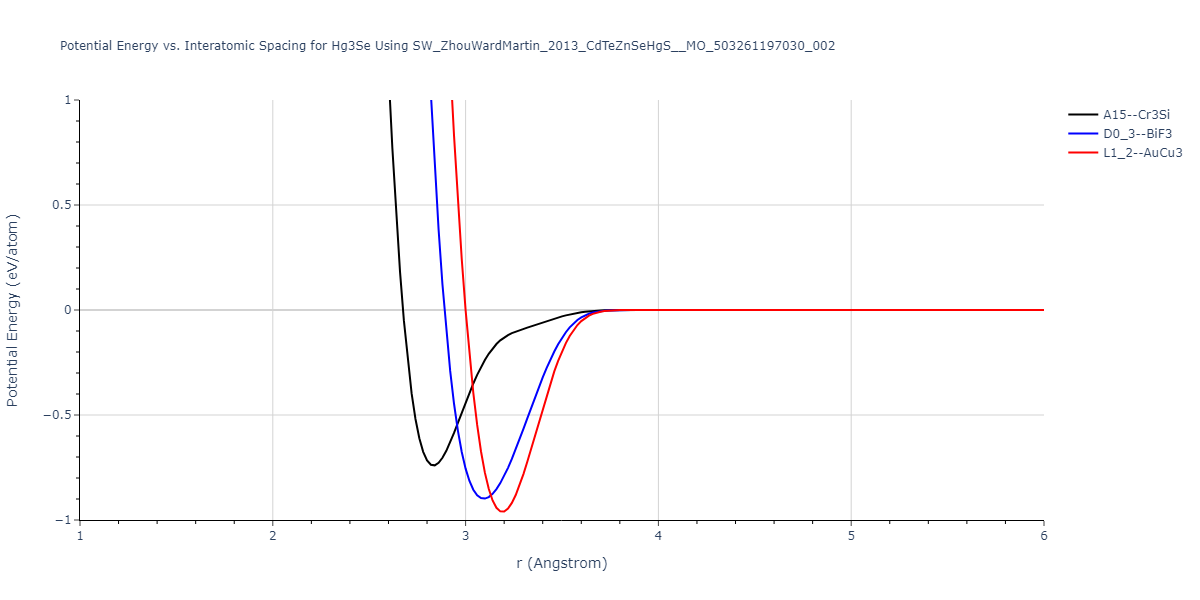
| D0_3--BiF3 | dynamic | -1.5052 | -1.5052 | 7.1716 | 7.1716 | 7.1716 | 90.0 | 90.0 | 90.0 |
| L1_2--AuCu3 | static | -1.4839 | -1.4839 | 4.5721 | 4.5721 | 4.5721 | 90.0 | 90.0 | 90.0 |
| A15--Cr3Si | box | -1.3685 | -1.3685 | 5.7406 | 5.7406 | 5.7406 | 90.0 | 90.0 | 90.0 |
Download raw data (including filtered results)
Reference structure matches:
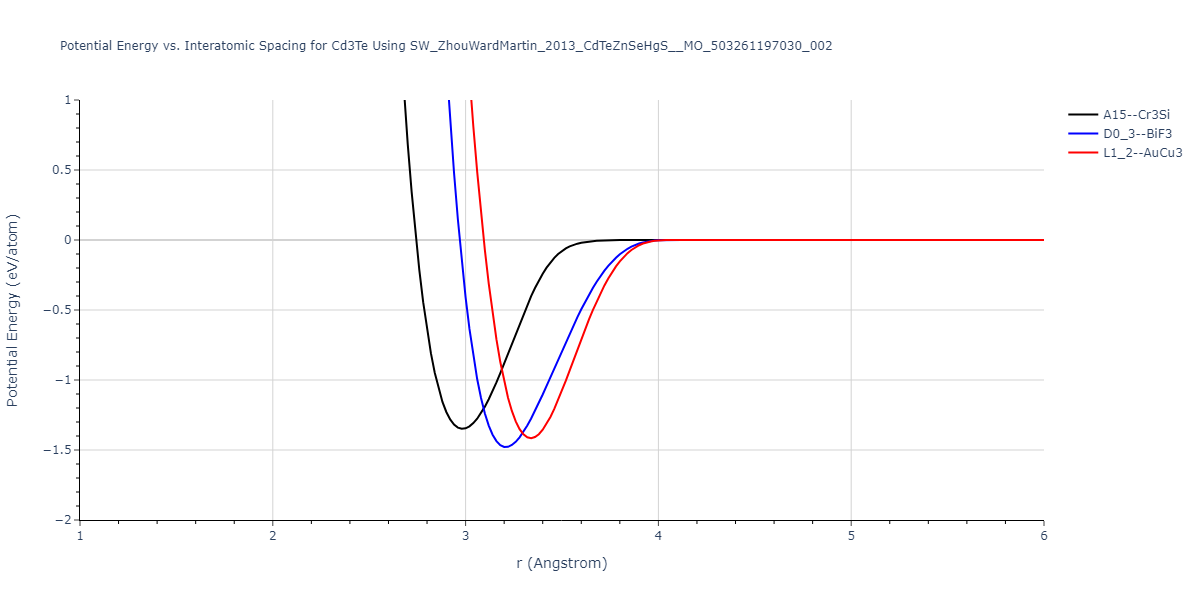
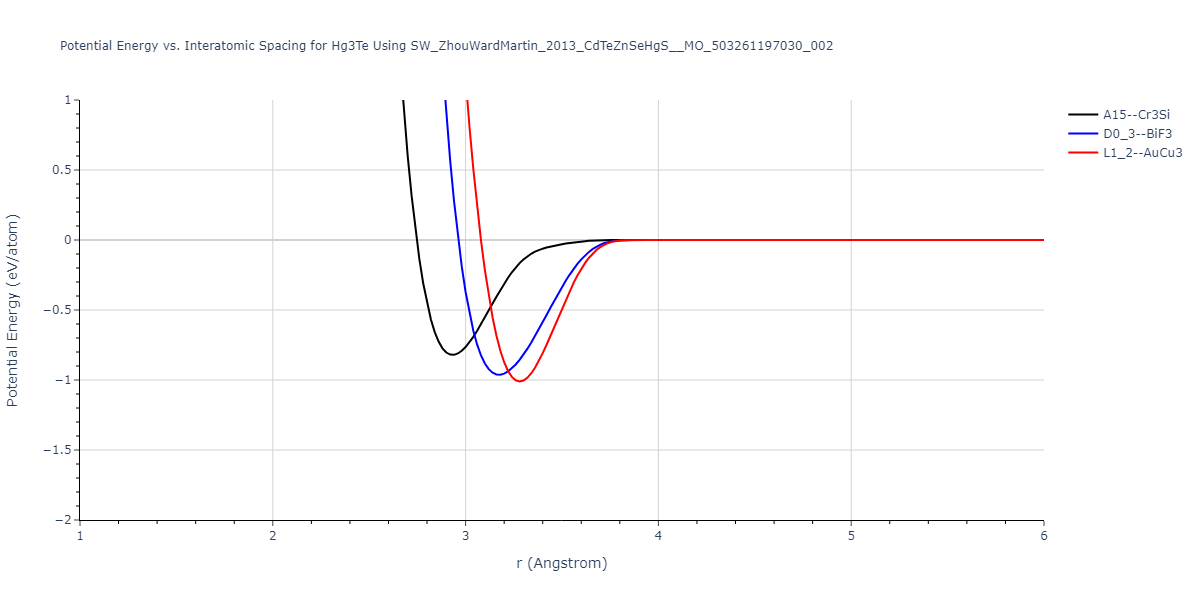
D0_3--BiF3 = oqmd-313598
L1_2--AuCu3 = oqmd-346784
| prototype | method | Ecoh (eV/atom) | Epot (eV/atom) | a0 (Å) | b0 (Å) | c0 (Å) | α (degrees) | β (degrees) | γ (degrees) |
|---|
| D0_3--BiF3 | dynamic | -1.4791 | -1.4791 | 7.4101 | 7.4101 | 7.4101 | 90.0 | 90.0 | 90.0 |
| oqmd-322298 | static | -1.4521 | -1.4521 | 6.7139 | 6.7139 | 5.3544 | 90.0 | 90.0 | 120.0 |
| oqmd-322298 | box | -1.4517 | -1.4517 | 6.7086 | 6.7086 | 5.3634 | 90.0 | 90.0 | 120.0 |
| L1_2--AuCu3 | static | -1.4156 | -1.4156 | 4.7209 | 4.7209 | 4.7209 | 90.0 | 90.0 | 90.0 |
| A15--Cr3Si | static | -1.3488 | -1.3488 | 5.968 | 5.968 | 5.968 | 90.0 | 90.0 | 90.0 |
Download raw data (including filtered results)
Reference structure matches:
| prototype | method | Ecoh (eV/atom) | Epot (eV/atom) | a0 (Å) | b0 (Å) | c0 (Å) | α (degrees) | β (degrees) | γ (degrees) |
|---|
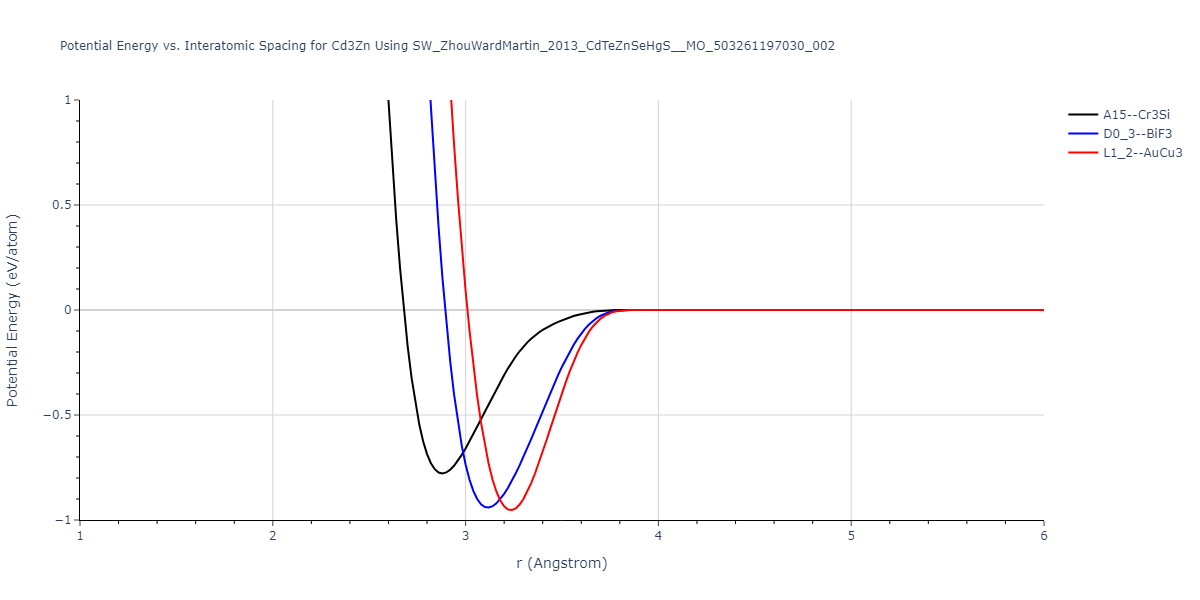
| L1_2--AuCu3 | static | -0.953 | -0.953 | 4.5747 | 4.5747 | 4.5747 | 90.0 | 90.0 | 90.0 |
| D0_3--BiF3 | dynamic | -0.9407 | -0.9407 | 7.1947 | 7.1947 | 7.1947 | 90.0 | 90.0 | 90.0 |
| A15--Cr3Si | static | -0.7783 | -0.7783 | 5.758 | 5.758 | 5.758 | 90.0 | 90.0 | 90.0 |
Download raw data (including filtered results)
Reference structure matches:
| prototype | method | Ecoh (eV/atom) | Epot (eV/atom) | a0 (Å) | b0 (Å) | c0 (Å) | α (degrees) | β (degrees) | γ (degrees) |
|---|
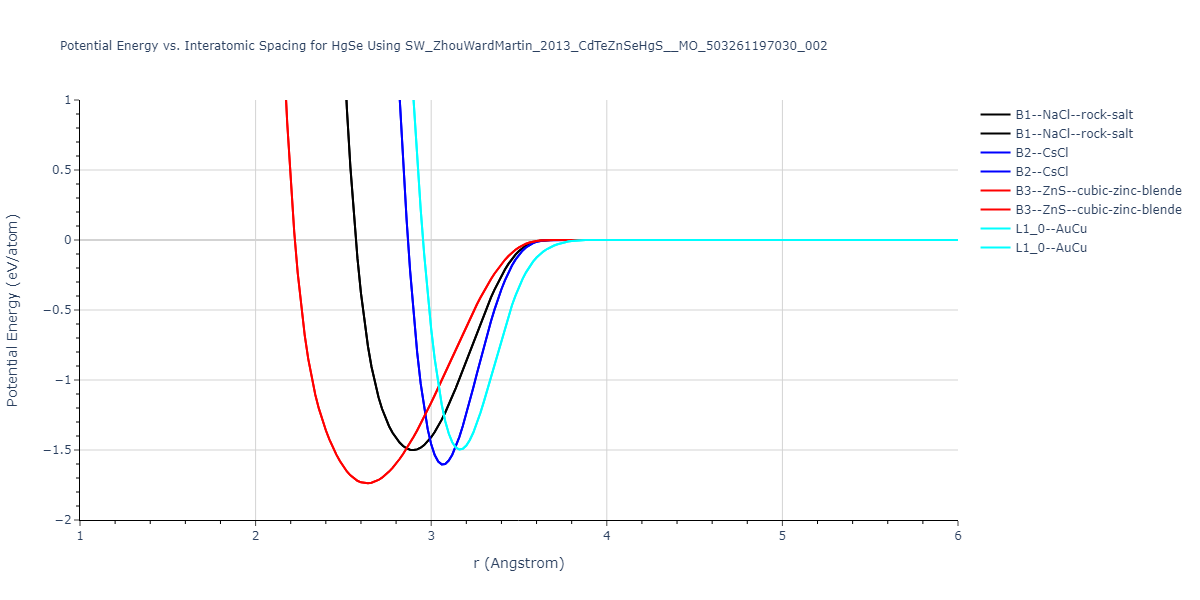
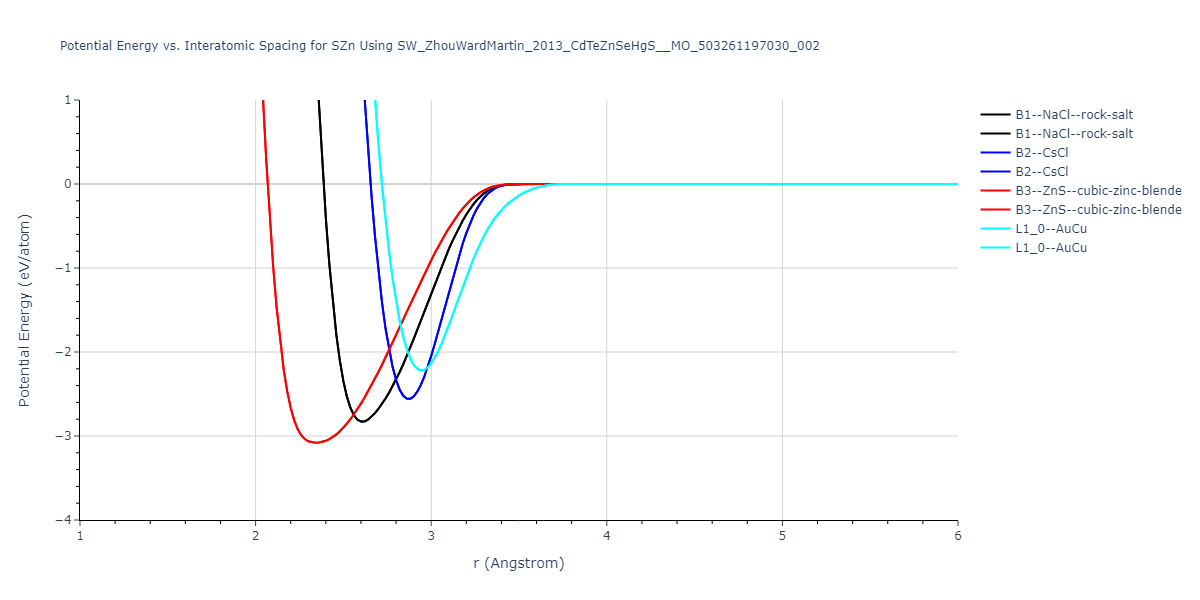
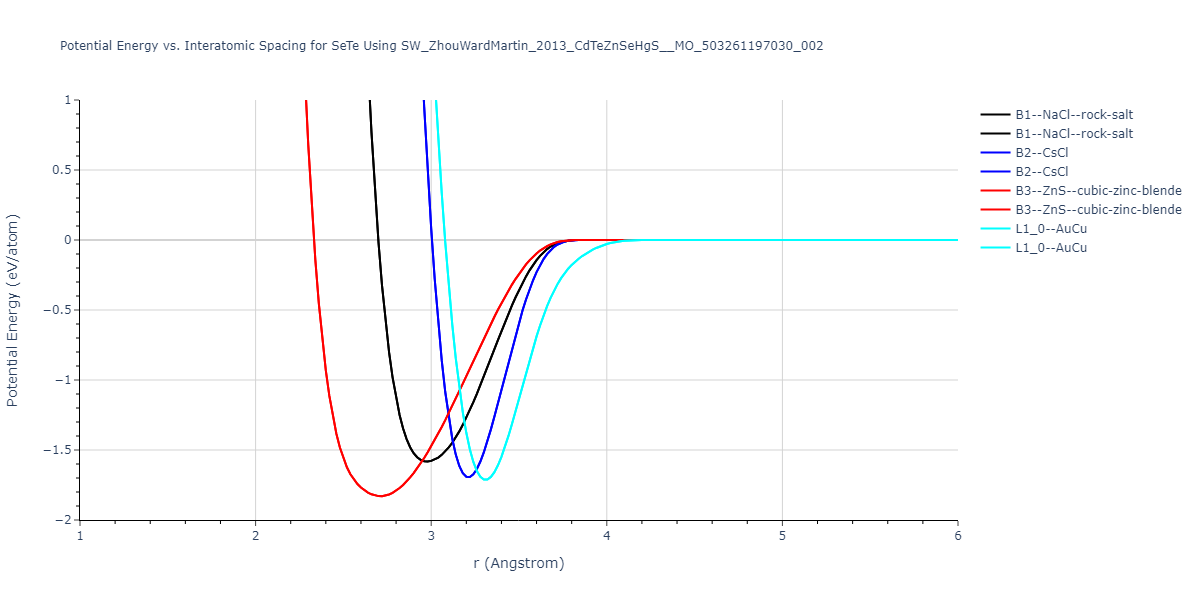
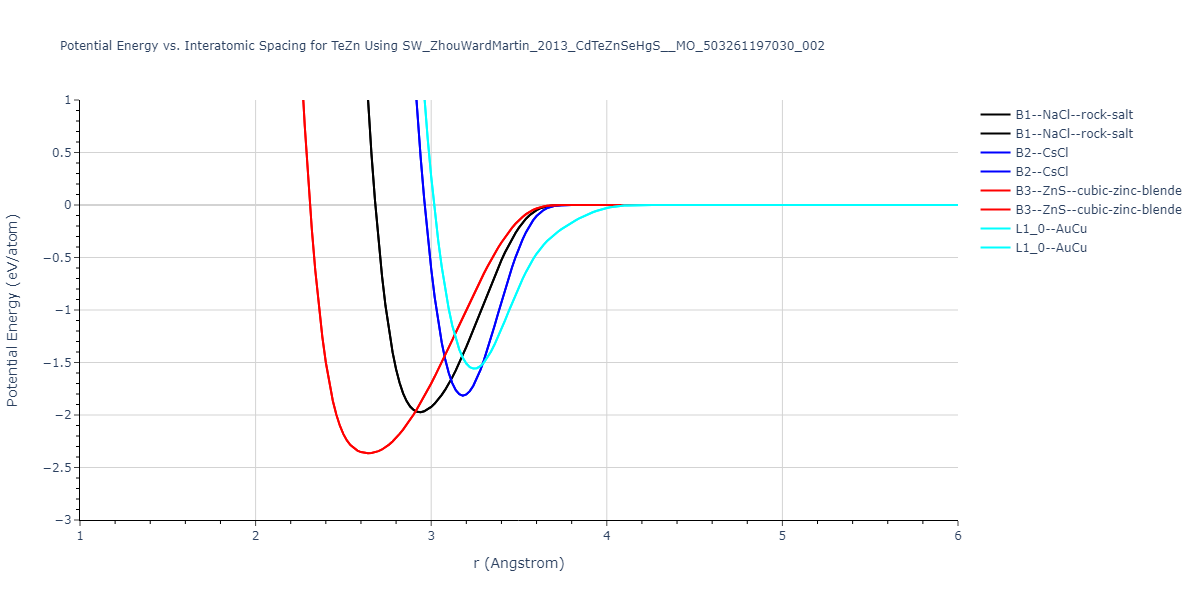
| B3--ZnS--cubic-zinc-blende | dynamic | -0.7 | -0.7 | 6.128 | 6.128 | 6.128 | 90.0 | 90.0 | 90.0 |
| L1_0--AuCu | static | -0.6788 | -0.6788 | 3.2282 | 3.2282 | 4.5711 | 90.0 | 90.0 | 90.0 |
| B2--CsCl | dynamic | -0.6349 | -0.6349 | 3.5426 | 3.5426 | 3.5426 | 90.0 | 90.0 | 90.0 |
| B1--NaCl--rock-salt | dynamic | -0.6124 | -0.6124 | 5.8843 | 5.8843 | 5.8843 | 90.0 | 90.0 | 90.0 |
Download raw data (including filtered results)
Reference structure matches:
| prototype | method | Ecoh (eV/atom) | Epot (eV/atom) | a0 (Å) | b0 (Å) | c0 (Å) | α (degrees) | β (degrees) | γ (degrees) |
|---|
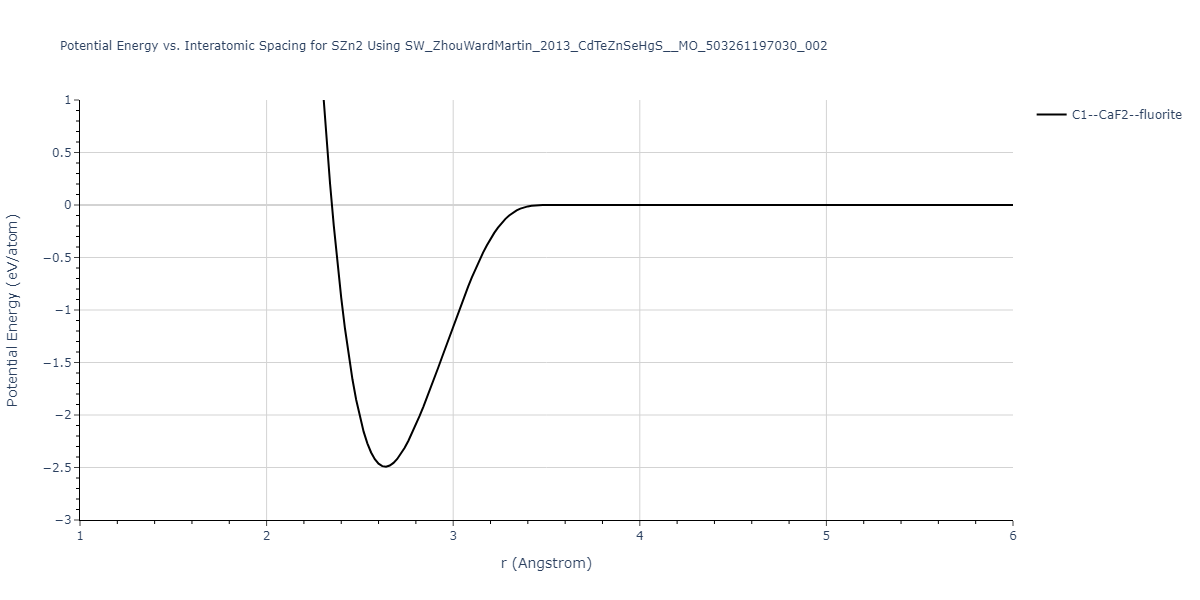
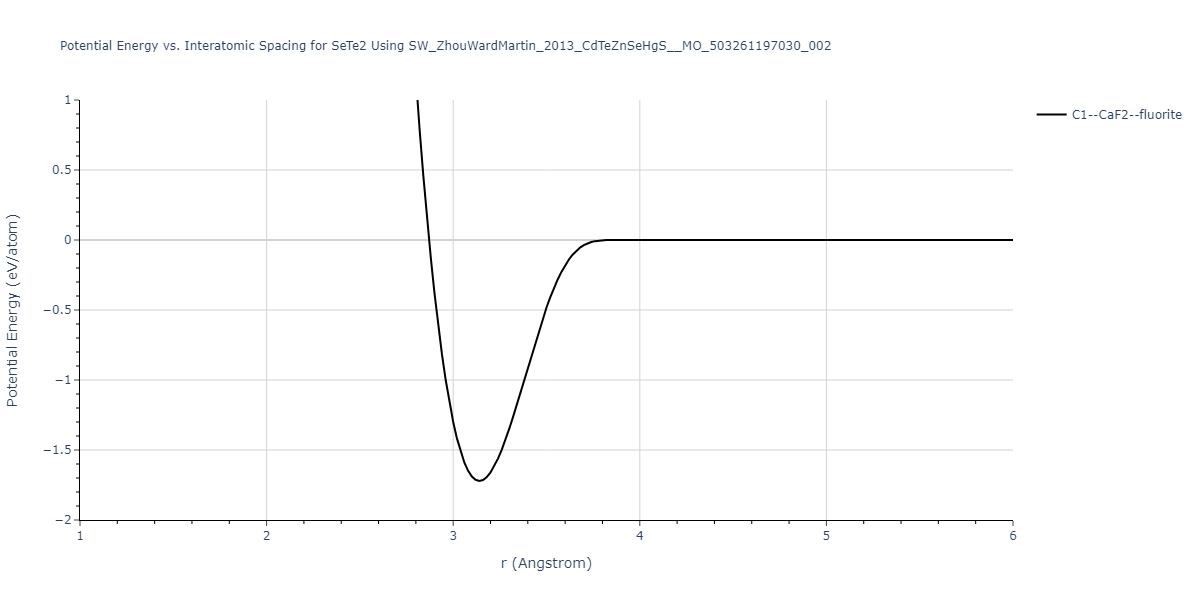
| C1--CaF2--fluorite | dynamic | -0.6083 | -0.6083 | 6.8167 | 6.8167 | 6.8167 | 90.0 | 90.0 | 90.0 |
Download raw data (including filtered results)
Reference structure matches:
| prototype | method | Ecoh (eV/atom) | Epot (eV/atom) | a0 (Å) | b0 (Å) | c0 (Å) | α (degrees) | β (degrees) | γ (degrees) |
|---|
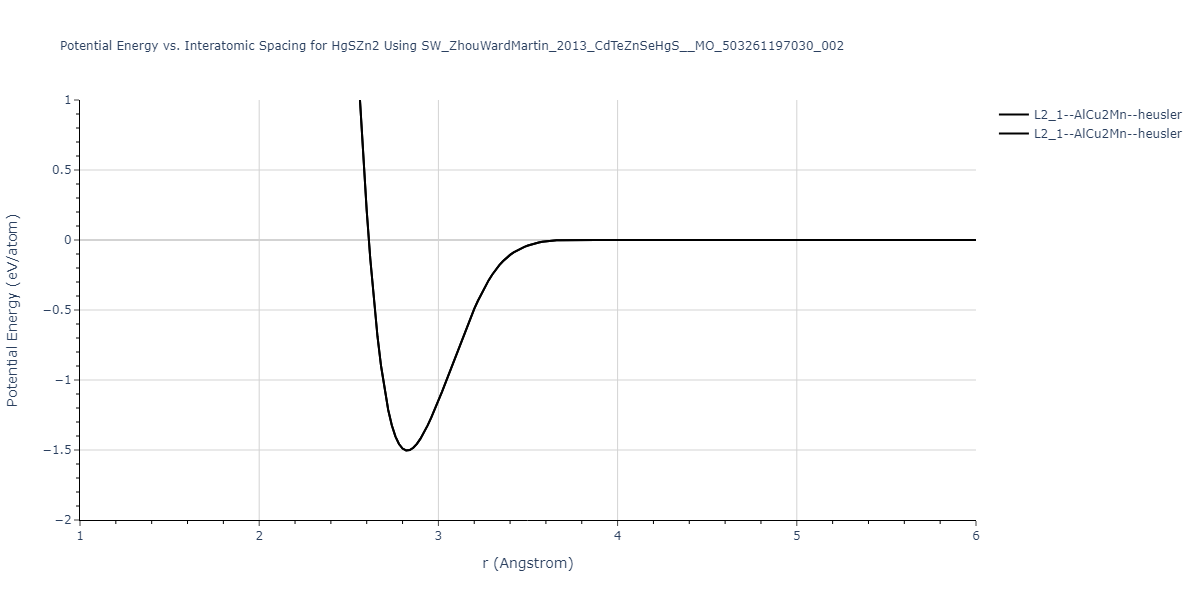
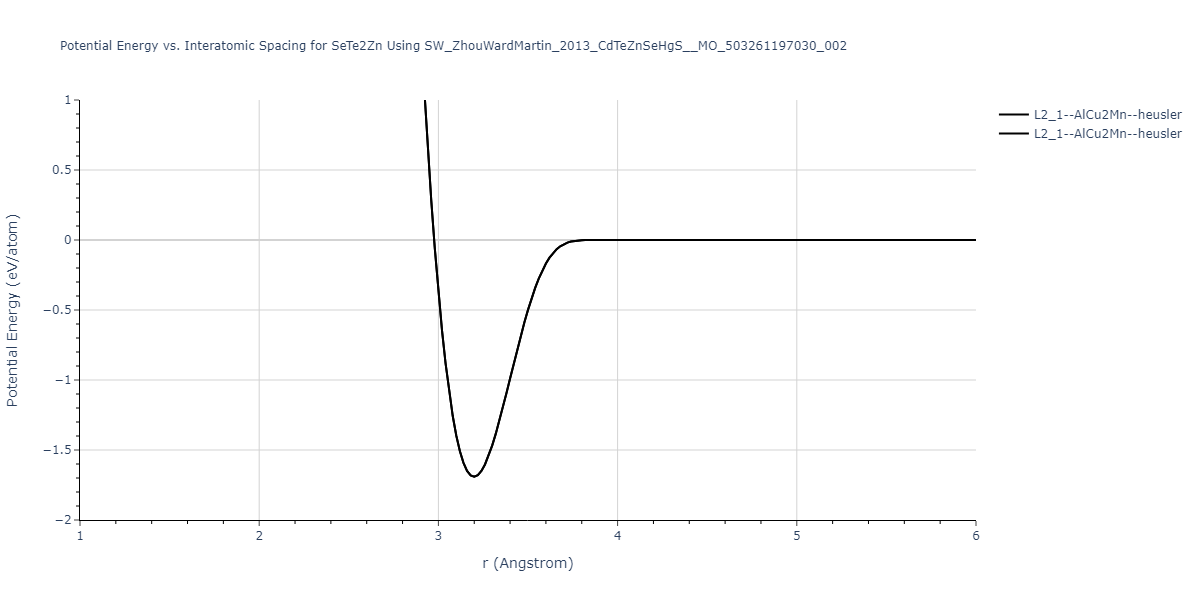
| L2_1--AlCu2Mn--heusler | static | -1.1049 | -1.1049 | 6.8651 | 6.8651 | 6.8651 | 90.0 | 90.0 | 90.0 |
Download raw data (including filtered results)
Reference structure matches:
| prototype | method | Ecoh (eV/atom) | Epot (eV/atom) | a0 (Å) | b0 (Å) | c0 (Å) | α (degrees) | β (degrees) | γ (degrees) |
|---|
| L2_1--AlCu2Mn--heusler | static | -1.0837 | -1.0837 | 7.0317 | 7.0317 | 7.0317 | 90.0 | 90.0 | 90.0 |
Download raw data (including filtered results)
Reference structure matches:
| prototype | method | Ecoh (eV/atom) | Epot (eV/atom) | a0 (Å) | b0 (Å) | c0 (Å) | α (degrees) | β (degrees) | γ (degrees) |
|---|
| L2_1--AlCu2Mn--heusler | static | -1.0586 | -1.0586 | 7.309 | 7.309 | 7.309 | 90.0 | 90.0 | 90.0 |
Download raw data (including filtered results)
Reference structure matches:
| prototype | method | Ecoh (eV/atom) | Epot (eV/atom) | a0 (Å) | b0 (Å) | c0 (Å) | α (degrees) | β (degrees) | γ (degrees) |
|---|
| L2_1--AlCu2Mn--heusler | static | -0.6394 | -0.6394 | 7.0732 | 7.0732 | 7.0732 | 90.0 | 90.0 | 90.0 |
Download raw data (including filtered results)
Reference structure matches:
D0_3--BiF3 = mp-1183639
| prototype | method | Ecoh (eV/atom) | Epot (eV/atom) | a0 (Å) | b0 (Å) | c0 (Å) | α (degrees) | β (degrees) | γ (degrees) |
|---|
| L1_2--AuCu3 | dynamic | -0.5963 | -0.5963 | 4.5989 | 4.5989 | 4.5989 | 90.0 | 90.0 | 90.0 |
| D0_3--BiF3 | static | -0.5405 | -0.5405 | 7.2925 | 7.2925 | 7.2925 | 90.0 | 90.0 | 90.0 |
| A15--Cr3Si | box | -0.358 | -0.358 | 5.8519 | 5.8519 | 5.8519 | 90.0 | 90.0 | 90.0 |
Download raw data (including filtered results)
Reference structure matches:
| prototype | method | Ecoh (eV/atom) | Epot (eV/atom) | a0 (Å) | b0 (Å) | c0 (Å) | α (degrees) | β (degrees) | γ (degrees) |
|---|
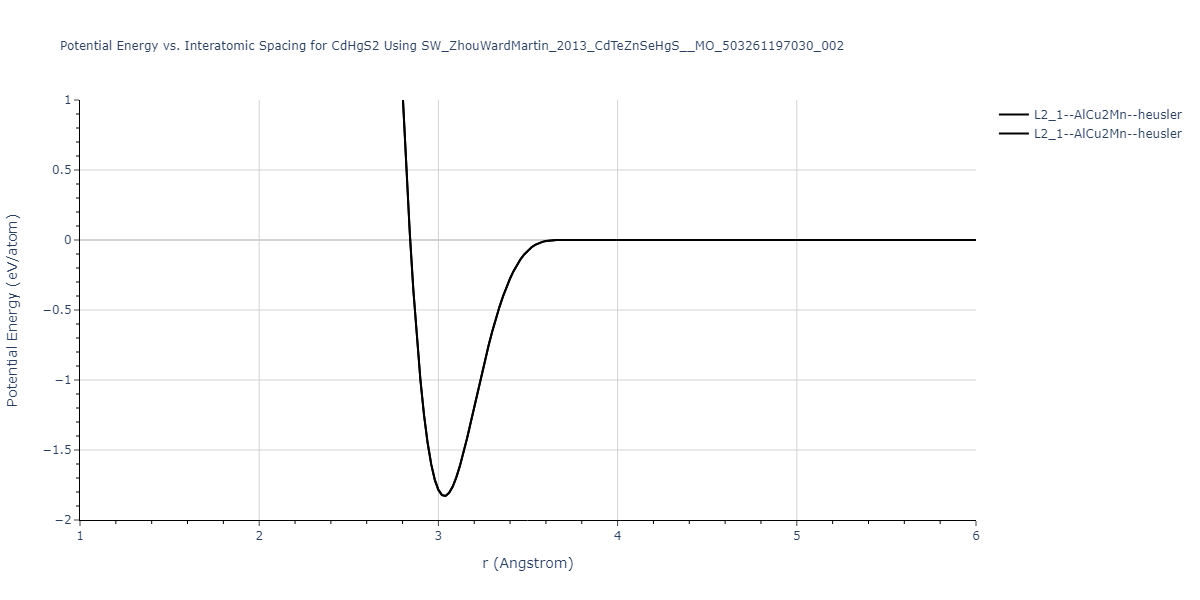
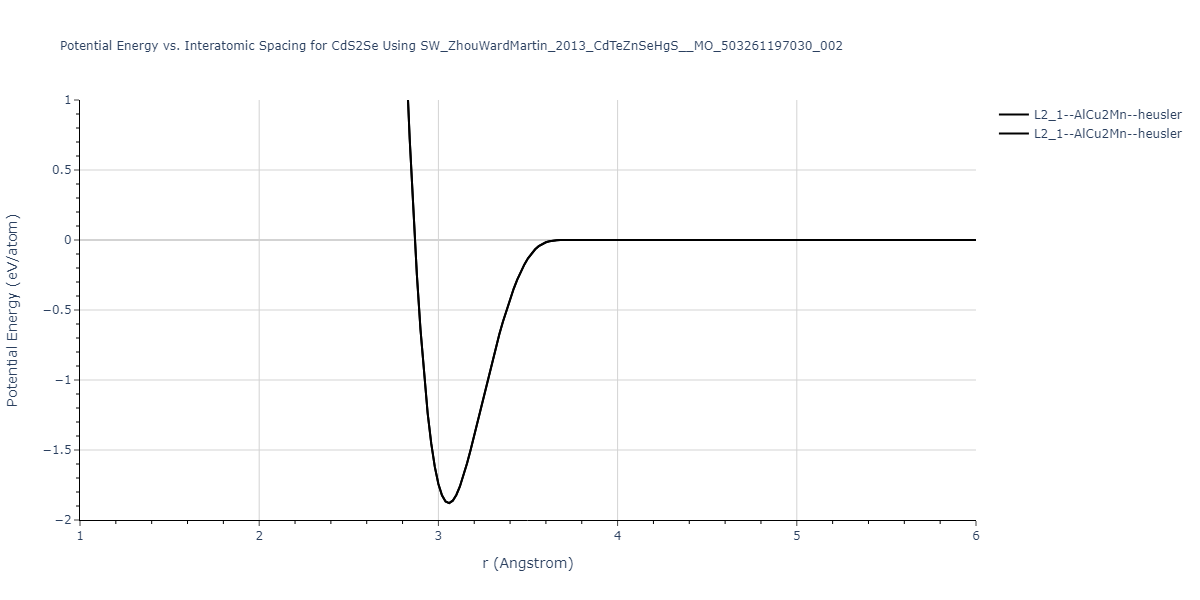
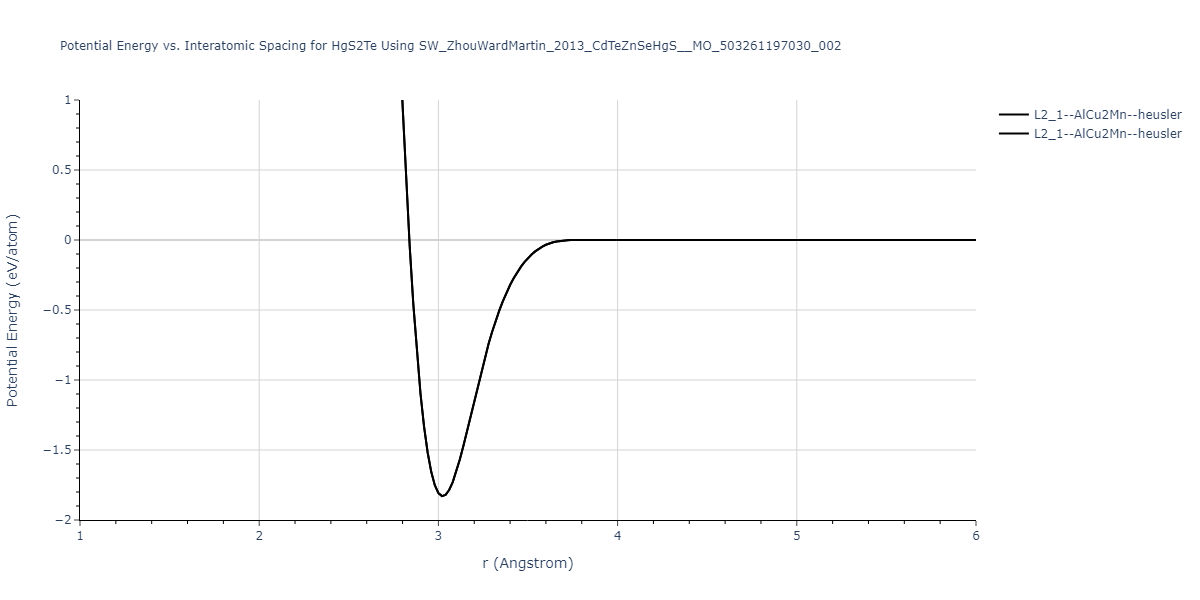
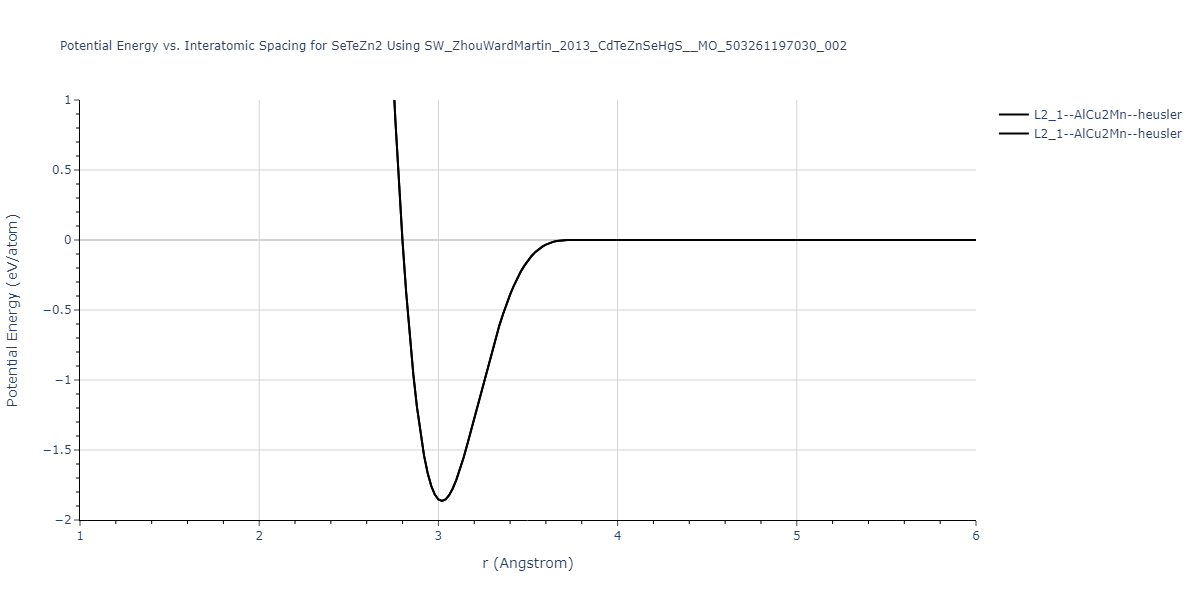
| L2_1--AlCu2Mn--heusler | static | -1.8292 | -1.8292 | 7.0063 | 7.0063 | 7.0063 | 90.0 | 90.0 | 90.0 |
Download raw data (including filtered results)
Reference structure matches:
| prototype | method | Ecoh (eV/atom) | Epot (eV/atom) | a0 (Å) | b0 (Å) | c0 (Å) | α (degrees) | β (degrees) | γ (degrees) |
|---|
| L2_1--AlCu2Mn--heusler | static | -1.7363 | -1.7363 | 7.1951 | 7.1951 | 7.1951 | 90.0 | 90.0 | 90.0 |
Download raw data (including filtered results)
Reference structure matches:
| prototype | method | Ecoh (eV/atom) | Epot (eV/atom) | a0 (Å) | b0 (Å) | c0 (Å) | α (degrees) | β (degrees) | γ (degrees) |
|---|
| L2_1--AlCu2Mn--heusler | static | -1.608 | -1.608 | 7.6069 | 7.6069 | 7.6069 | 90.0 | 90.0 | 90.0 |
Download raw data (including filtered results)
Reference structure matches:
| prototype | method | Ecoh (eV/atom) | Epot (eV/atom) | a0 (Å) | b0 (Å) | c0 (Å) | α (degrees) | β (degrees) | γ (degrees) |
|---|
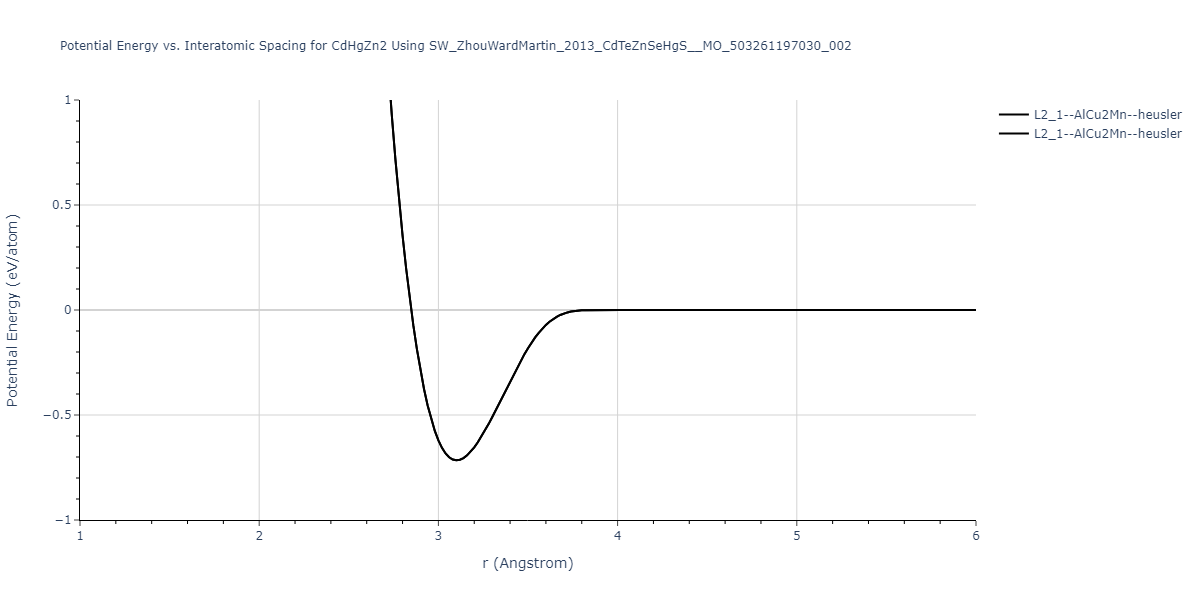
| L2_1--AlCu2Mn--heusler | static | -0.7156 | -0.7156 | 7.1631 | 7.1631 | 7.1631 | 90.0 | 90.0 | 90.0 |
Download raw data (including filtered results)
Reference structure matches:
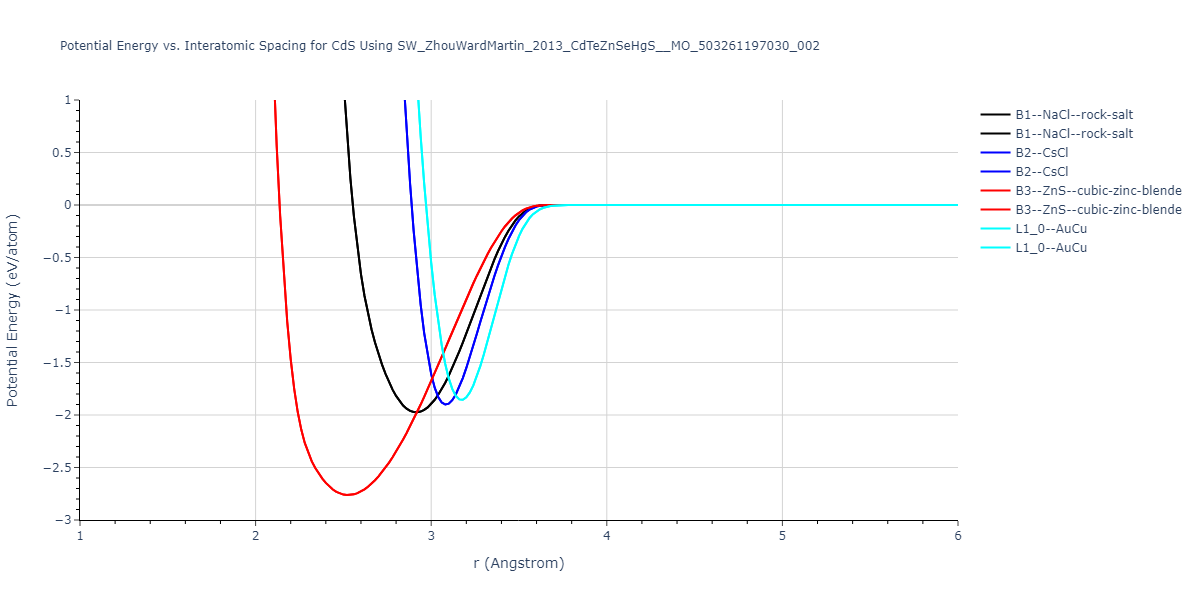
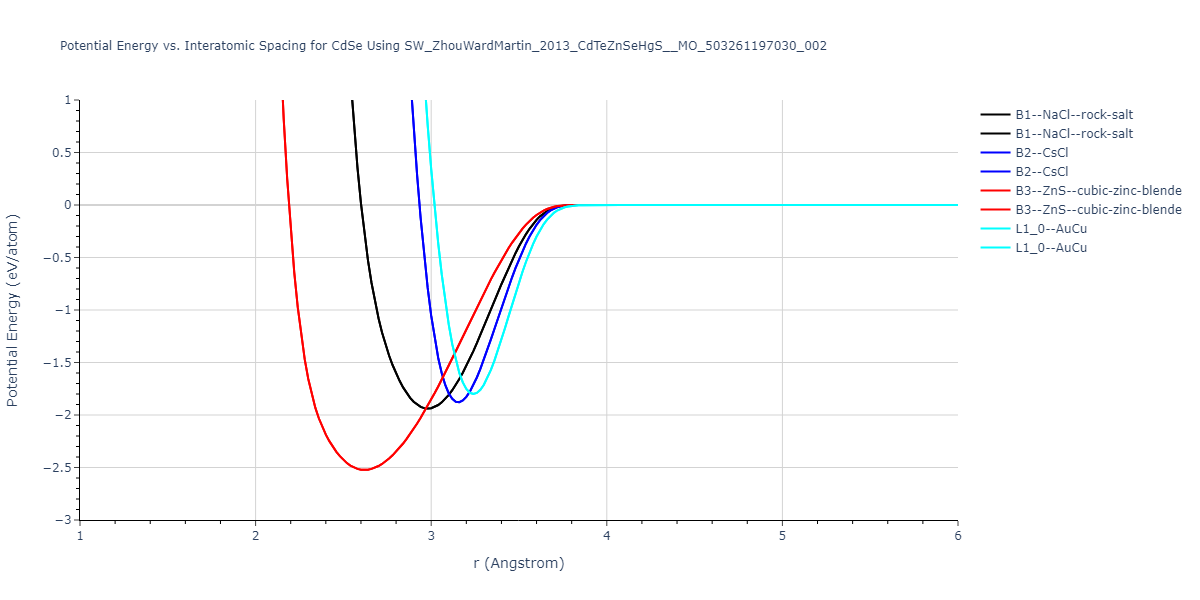
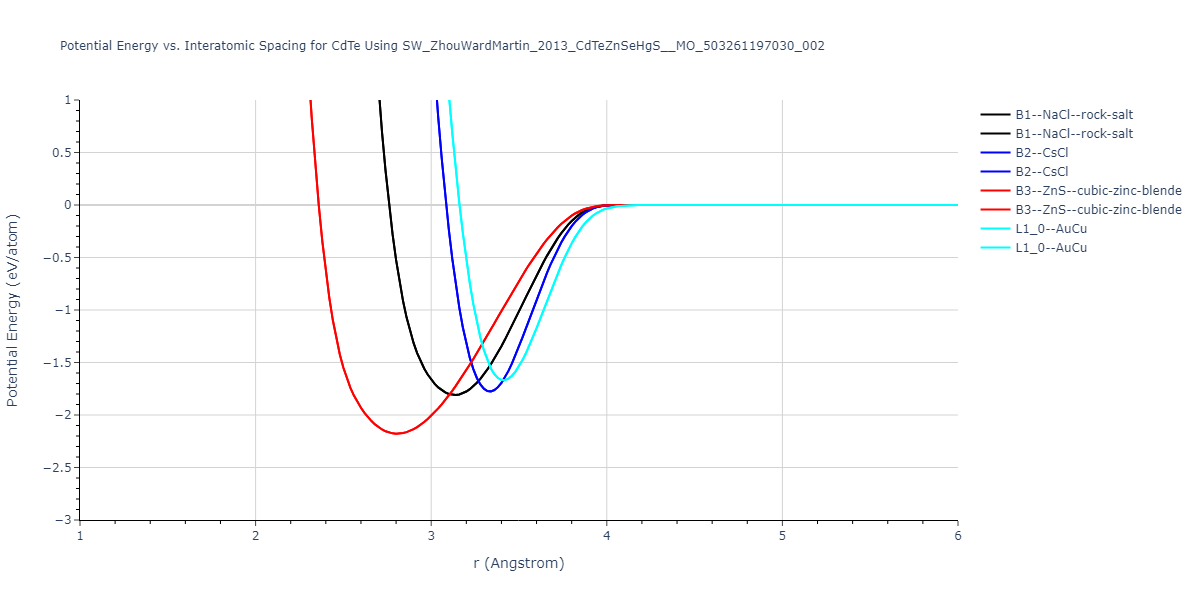
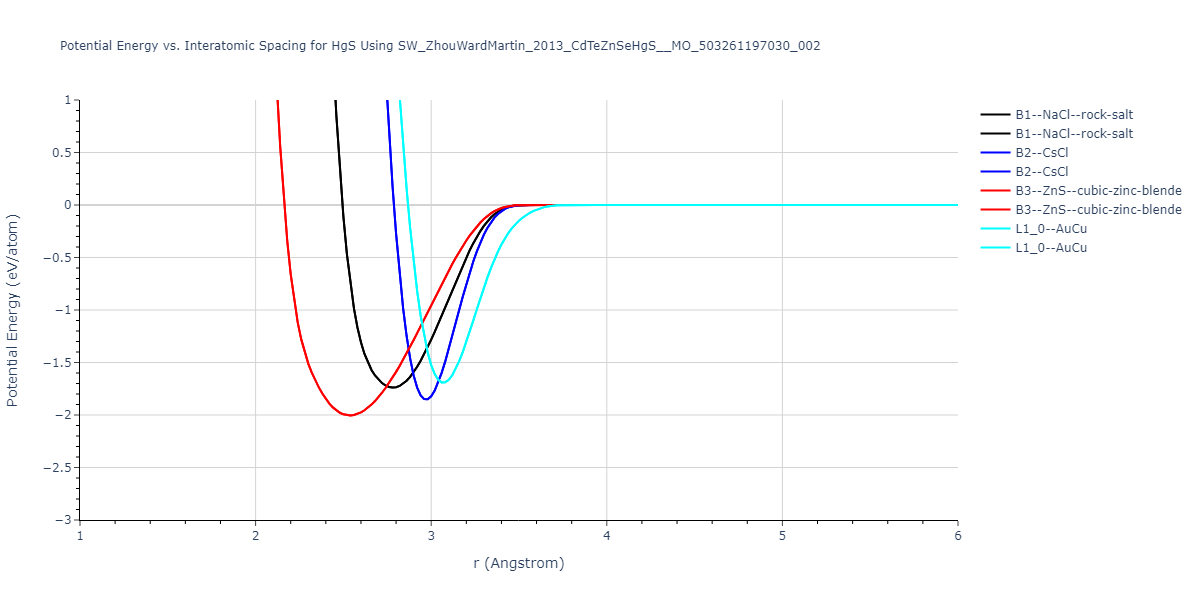
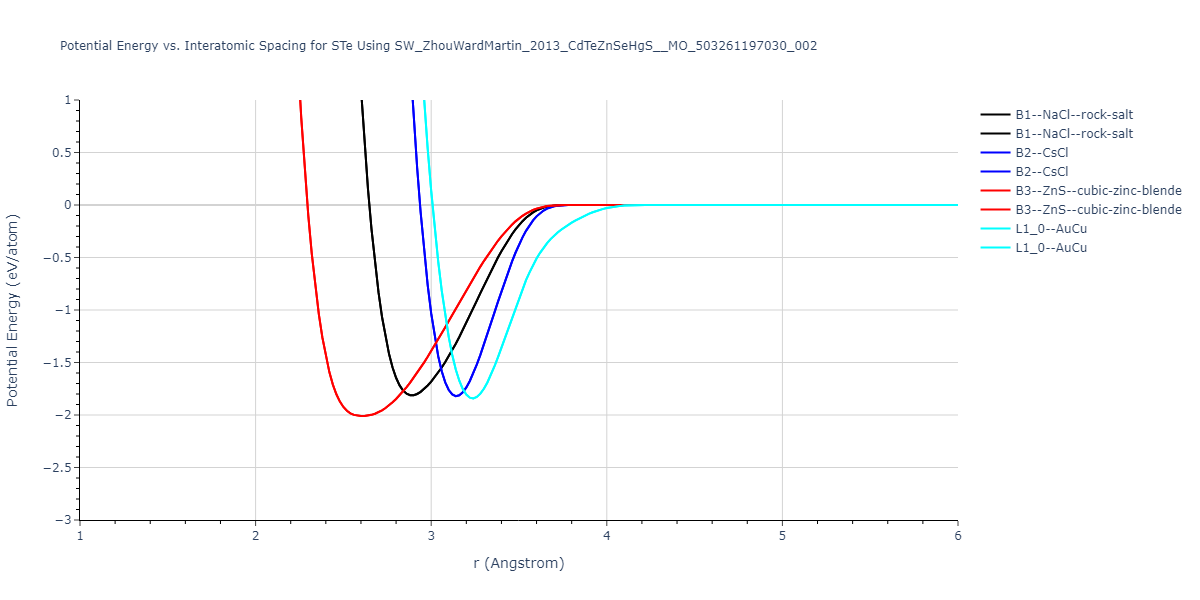
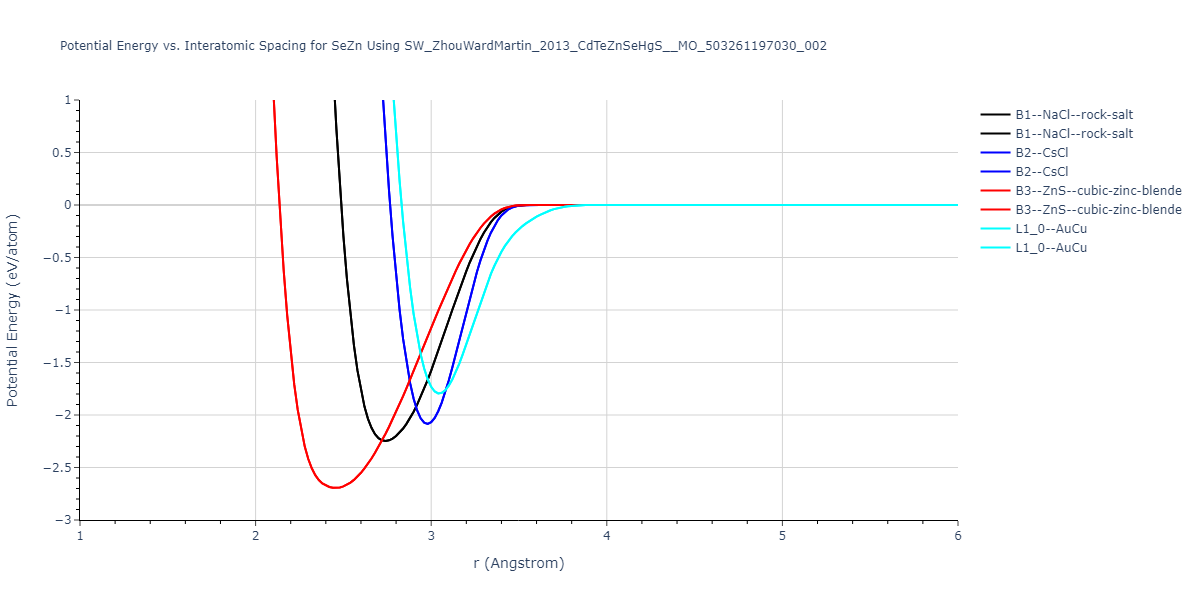
B1--NaCl--rock-salt = mp-370
B3--ZnS--cubic-zinc-blende = mp-2469
| prototype | method | Ecoh (eV/atom) | Epot (eV/atom) | a0 (Å) | b0 (Å) | c0 (Å) | α (degrees) | β (degrees) | γ (degrees) |
|---|
| B3--ZnS--cubic-zinc-blende | dynamic | -2.763 | -2.763 | 5.835 | 5.835 | 5.835 | 90.0 | 90.0 | 90.0 |
| B1--NaCl--rock-salt | static | -1.9745 | -1.9745 | 5.8291 | 5.8291 | 5.8291 | 90.0 | 90.0 | 90.0 |
| B2--CsCl | static | -1.9007 | -1.9007 | 3.5607 | 3.5607 | 3.5607 | 90.0 | 90.0 | 90.0 |
Download raw data (including filtered results)
Reference structure matches:
| prototype | method | Ecoh (eV/atom) | Epot (eV/atom) | a0 (Å) | b0 (Å) | c0 (Å) | α (degrees) | β (degrees) | γ (degrees) |
|---|
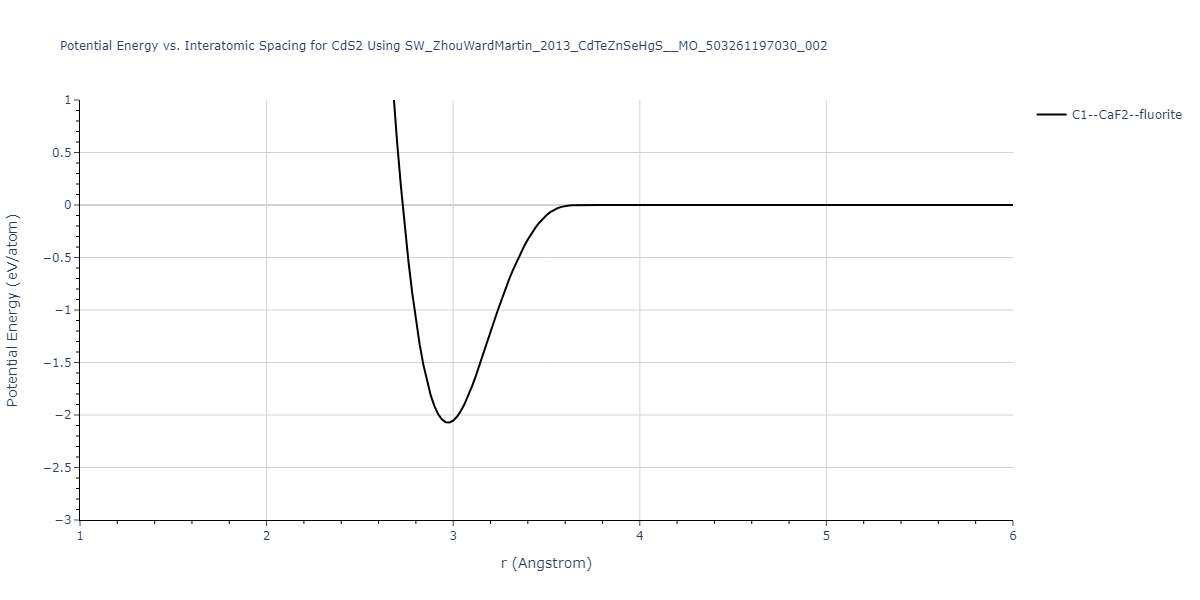
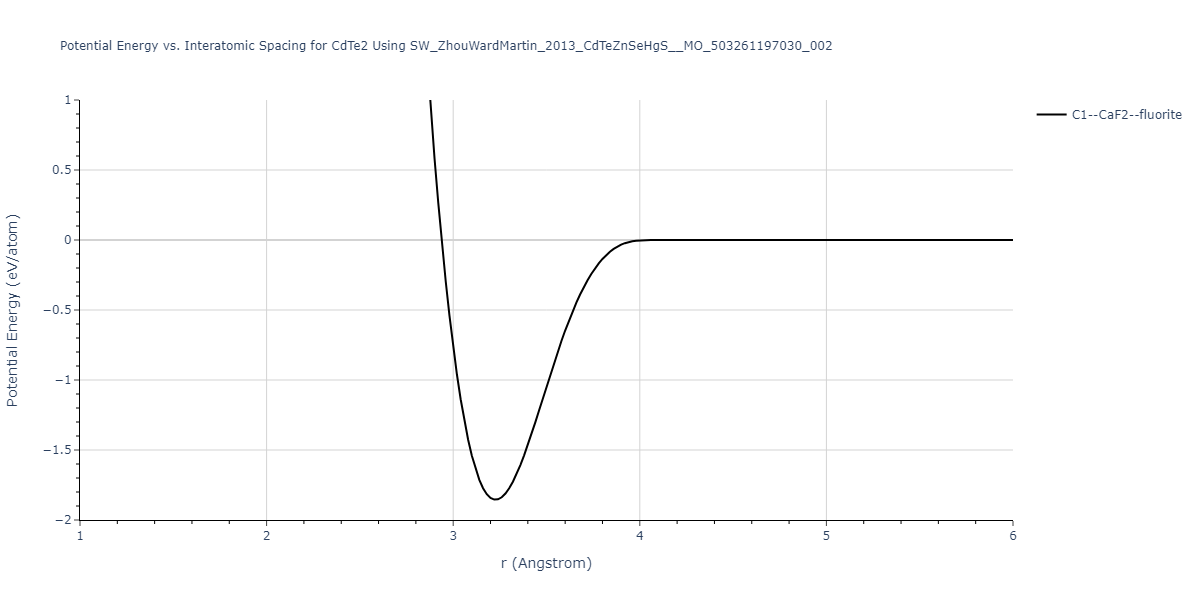
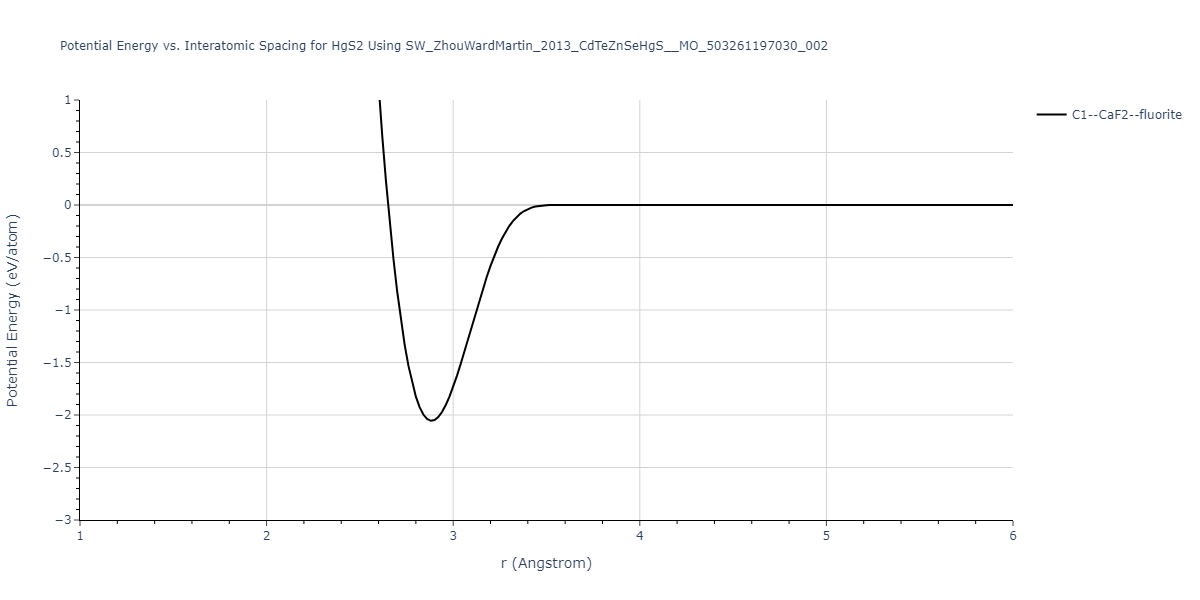
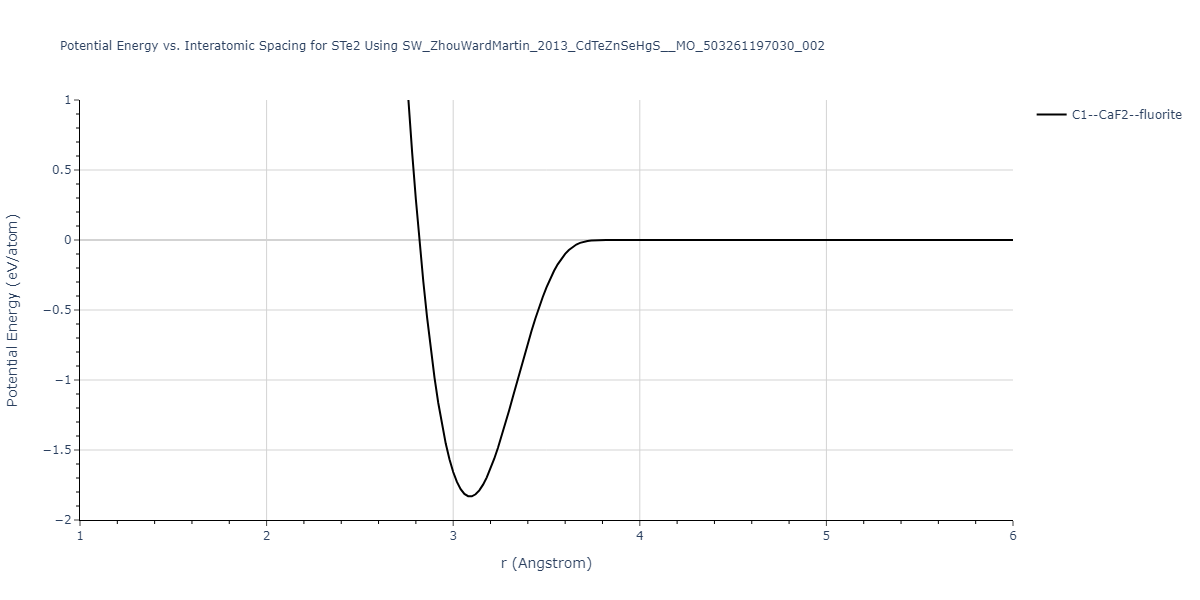
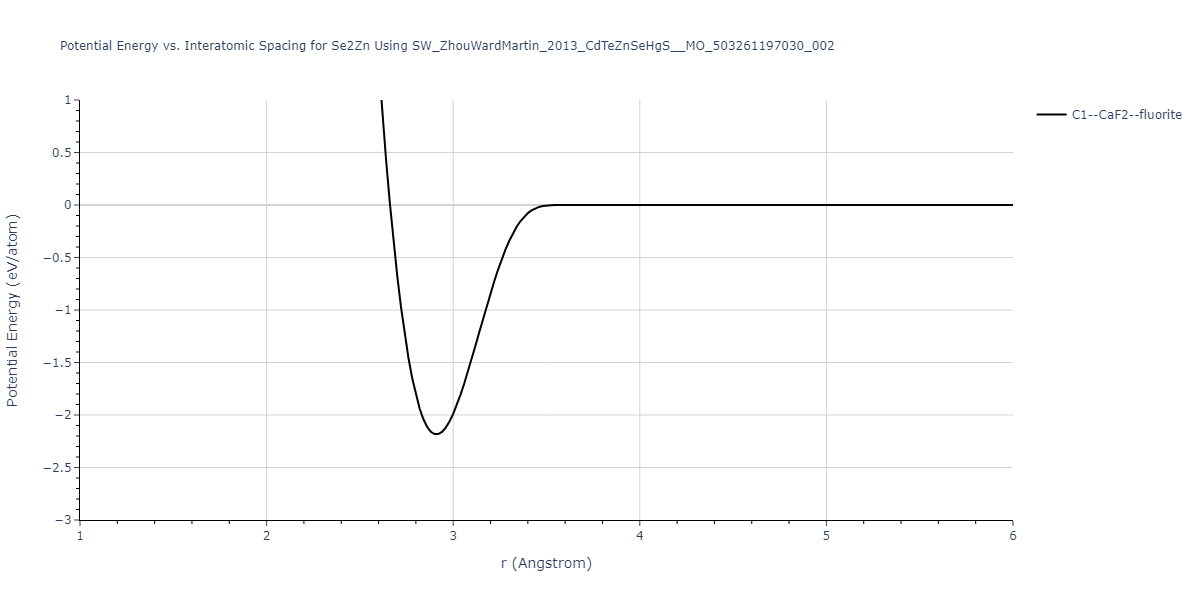
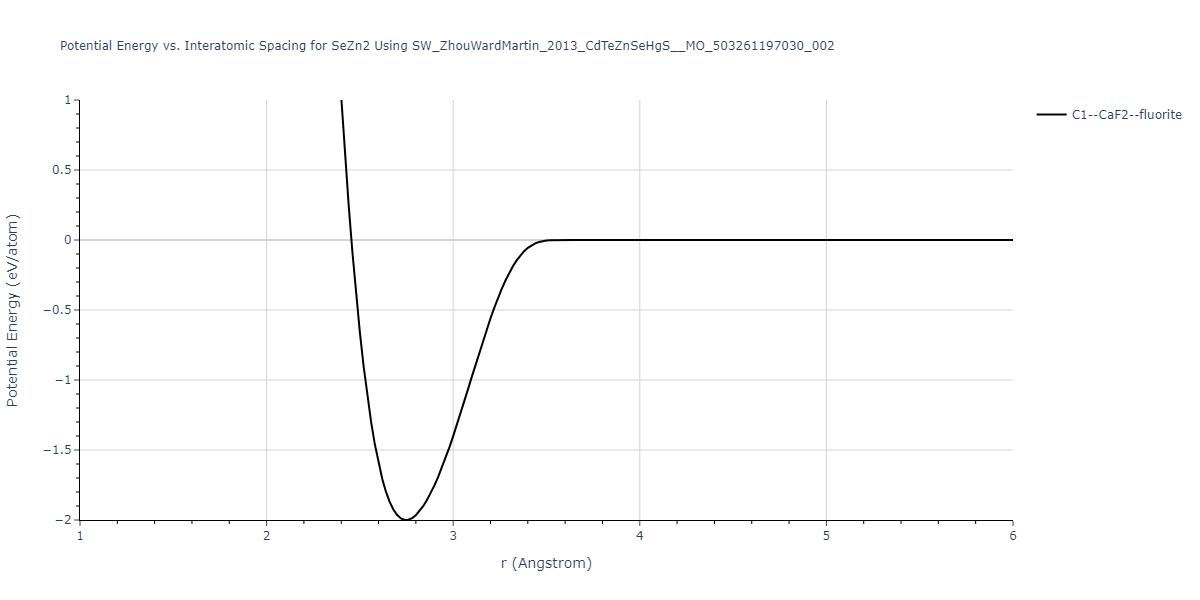
| C1--CaF2--fluorite | static | -2.0724 | -2.0724 | 6.8647 | 6.8647 | 6.8647 | 90.0 | 90.0 | 90.0 |
Download raw data (including filtered results)
Reference structure matches:
| prototype | method | Ecoh (eV/atom) | Epot (eV/atom) | a0 (Å) | b0 (Å) | c0 (Å) | α (degrees) | β (degrees) | γ (degrees) |
|---|
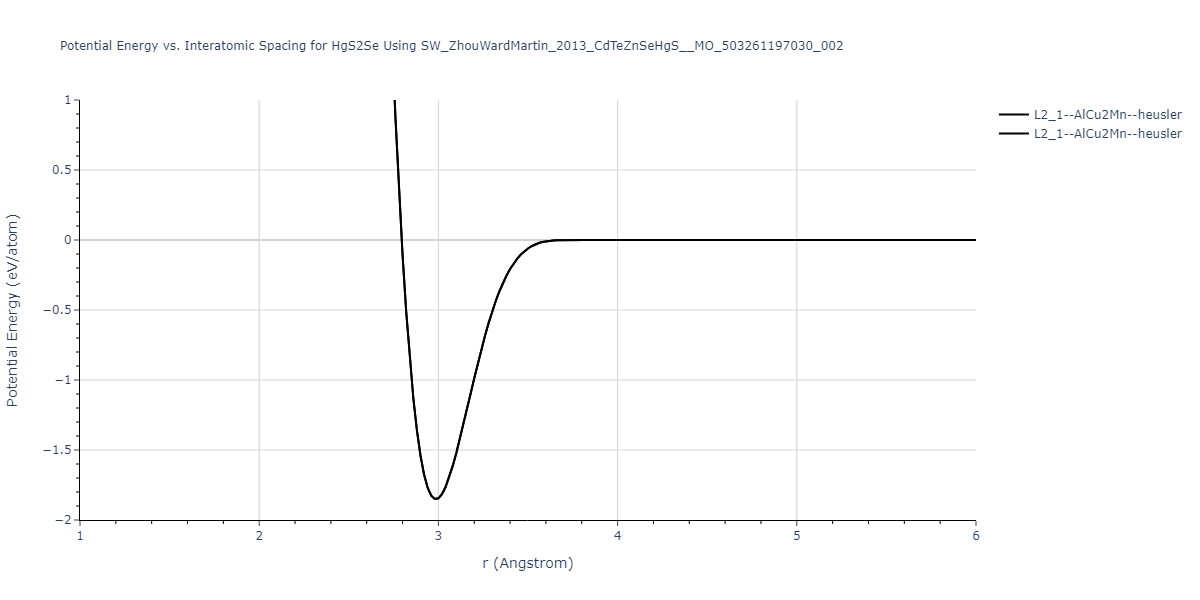
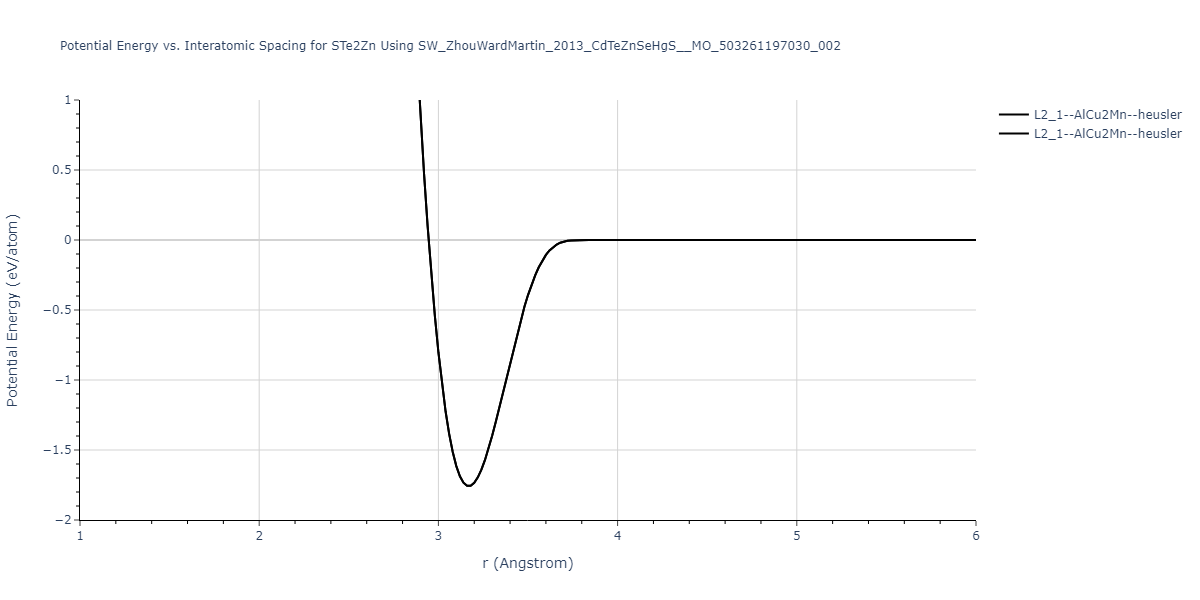
| L2_1--AlCu2Mn--heusler | static | -1.8792 | -1.8792 | 7.0609 | 7.0609 | 7.0609 | 90.0 | 90.0 | 90.0 |
Download raw data (including filtered results)
Reference structure matches:
| prototype | method | Ecoh (eV/atom) | Epot (eV/atom) | a0 (Å) | b0 (Å) | c0 (Å) | α (degrees) | β (degrees) | γ (degrees) |
|---|
| L2_1--AlCu2Mn--heusler | static | -1.8525 | -1.8525 | 7.1691 | 7.1691 | 7.1691 | 90.0 | 90.0 | 90.0 |
Download raw data (including filtered results)
Reference structure matches:
| prototype | method | Ecoh (eV/atom) | Epot (eV/atom) | a0 (Å) | b0 (Å) | c0 (Å) | α (degrees) | β (degrees) | γ (degrees) |
|---|
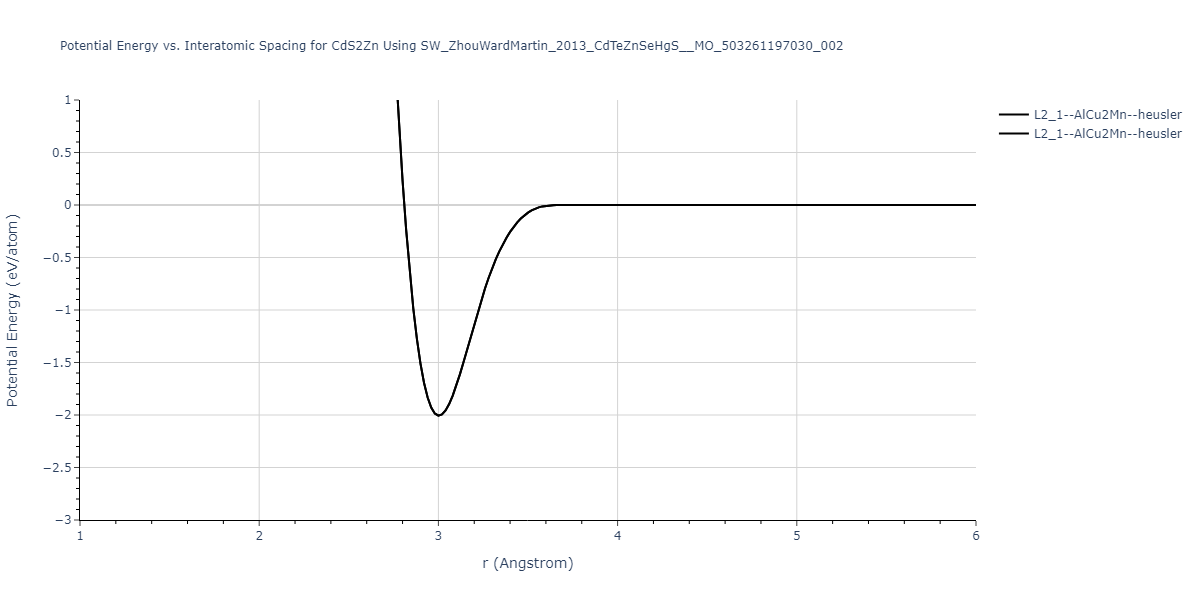
| L2_1--AlCu2Mn--heusler | static | -2.0059 | -2.0059 | 6.9348 | 6.9348 | 6.9348 | 90.0 | 90.0 | 90.0 |
Download raw data (including filtered results)
Reference structure matches:
| prototype | method | Ecoh (eV/atom) | Epot (eV/atom) | a0 (Å) | b0 (Å) | c0 (Å) | α (degrees) | β (degrees) | γ (degrees) |
|---|
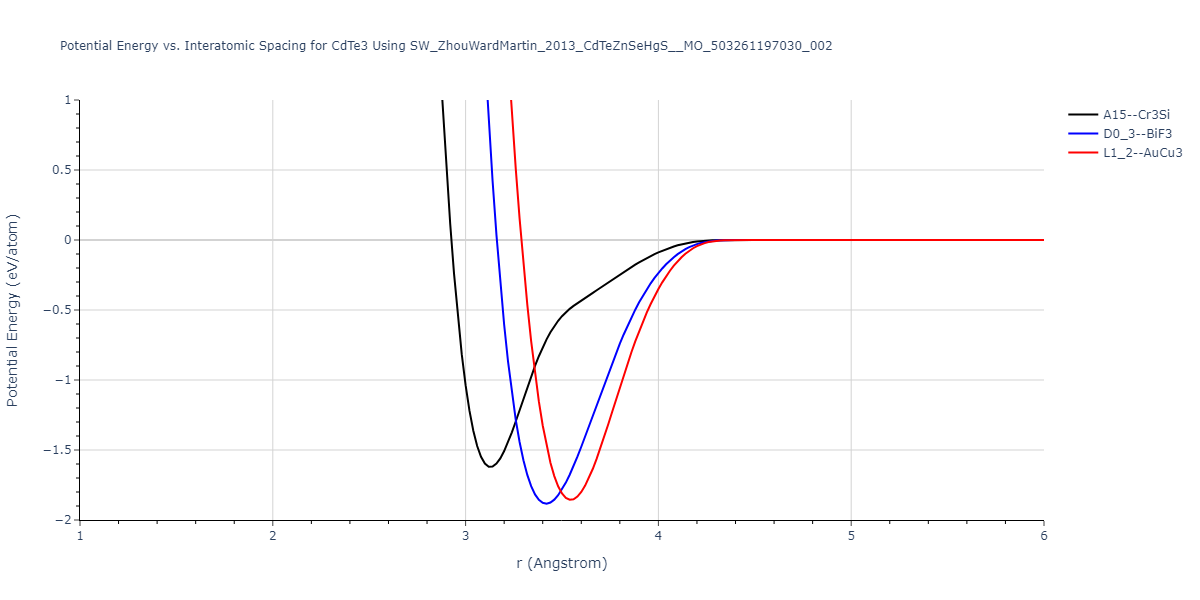
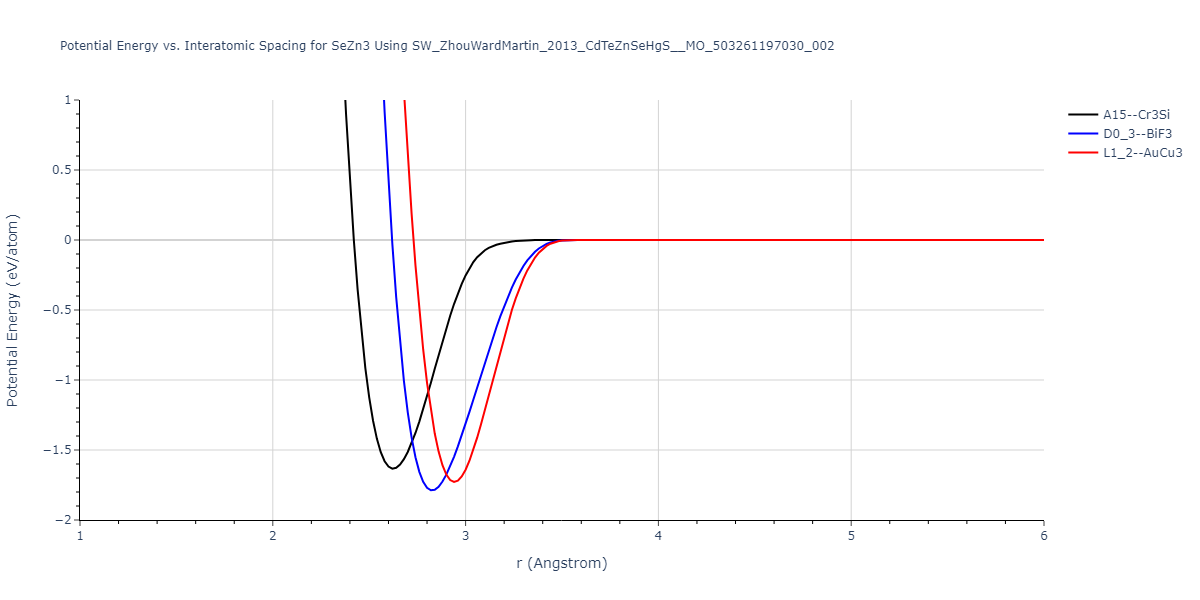
| D0_3--BiF3 | static | -2.3028 | -2.3028 | 7.2521 | 7.2521 | 7.2521 | 90.0 | 90.0 | 90.0 |
| L1_2--AuCu3 | static | -2.2837 | -2.2837 | 4.6063 | 4.6063 | 4.6063 | 90.0 | 90.0 | 90.0 |
| A15--Cr3Si | static | -1.8809 | -1.8809 | 5.7522 | 5.7522 | 5.7522 | 90.0 | 90.0 | 90.0 |
Download raw data (including filtered results)
Reference structure matches:
| prototype | method | Ecoh (eV/atom) | Epot (eV/atom) | a0 (Å) | b0 (Å) | c0 (Å) | α (degrees) | β (degrees) | γ (degrees) |
|---|
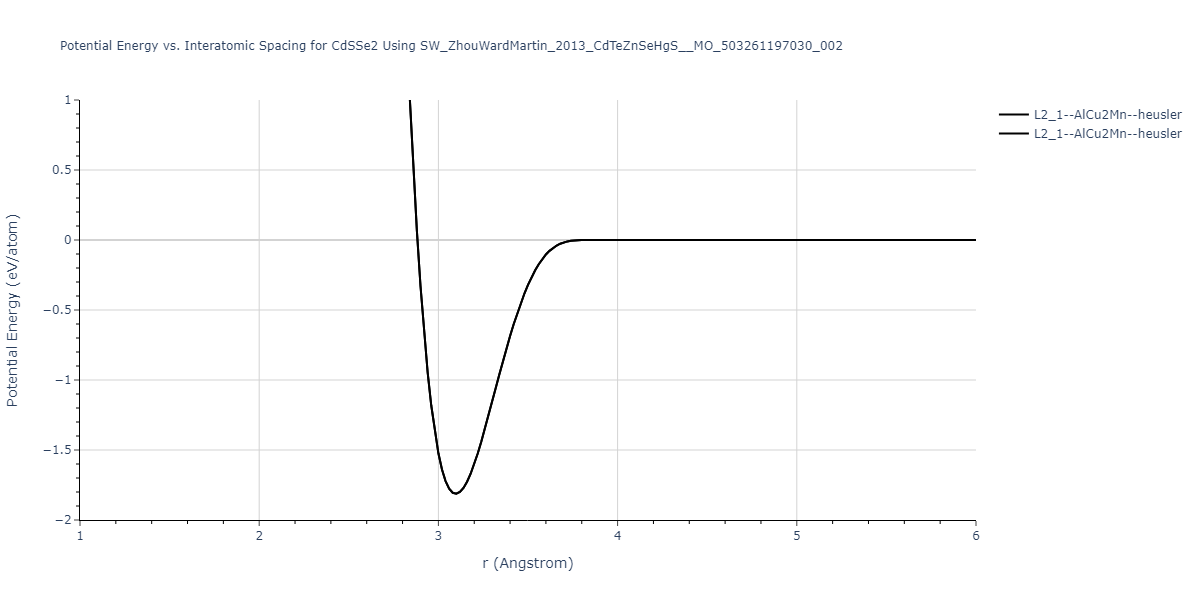
| L2_1--AlCu2Mn--heusler | static | -1.8127 | -1.8127 | 7.1518 | 7.1518 | 7.1518 | 90.0 | 90.0 | 90.0 |
Download raw data (including filtered results)
Reference structure matches:
| prototype | method | Ecoh (eV/atom) | Epot (eV/atom) | a0 (Å) | b0 (Å) | c0 (Å) | α (degrees) | β (degrees) | γ (degrees) |
|---|
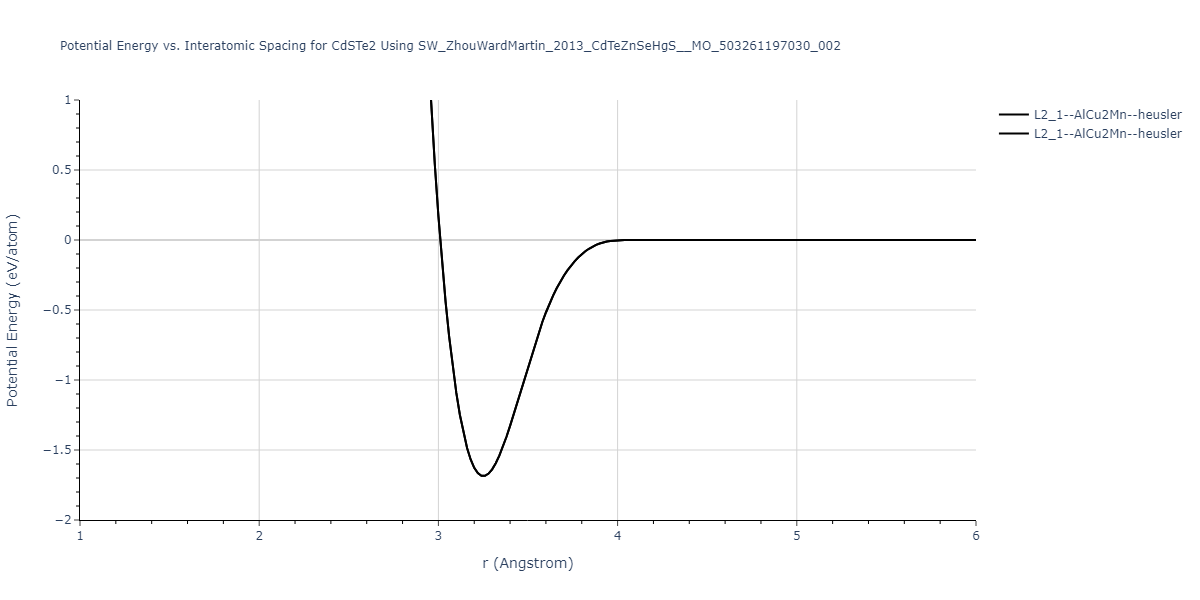
| L2_1--AlCu2Mn--heusler | static | -1.6862 | -1.6862 | 7.5069 | 7.5069 | 7.5069 | 90.0 | 90.0 | 90.0 |
Download raw data (including filtered results)
Reference structure matches:
| prototype | method | Ecoh (eV/atom) | Epot (eV/atom) | a0 (Å) | b0 (Å) | c0 (Å) | α (degrees) | β (degrees) | γ (degrees) |
|---|
| L2_1--AlCu2Mn--heusler | static | -1.3491 | -1.3491 | 6.7641 | 6.7641 | 6.7641 | 90.0 | 90.0 | 90.0 |
Download raw data (including filtered results)
Reference structure matches:
B1--NaCl--rock-salt = mp-1055
B3--ZnS--cubic-zinc-blende = mp-2691
| prototype | method | Ecoh (eV/atom) | Epot (eV/atom) | a0 (Å) | b0 (Å) | c0 (Å) | α (degrees) | β (degrees) | γ (degrees) |
|---|
| B3--ZnS--cubic-zinc-blende | dynamic | -2.523 | -2.523 | 6.05 | 6.05 | 6.05 | 90.0 | 90.0 | 90.0 |
| B1--NaCl--rock-salt | static | -1.9385 | -1.9385 | 5.9606 | 5.9606 | 5.9606 | 90.0 | 90.0 | 90.0 |
| B2--CsCl | static | -1.8782 | -1.8782 | 3.6414 | 3.6414 | 3.6414 | 90.0 | 90.0 | 90.0 |
Download raw data (including filtered results)
Reference structure matches:
| prototype | method | Ecoh (eV/atom) | Epot (eV/atom) | a0 (Å) | b0 (Å) | c0 (Å) | α (degrees) | β (degrees) | γ (degrees) |
|---|
| C1--CaF2--fluorite | static | -1.9821 | -1.9821 | 7.0224 | 7.0224 | 7.0224 | 90.0 | 90.0 | 90.0 |
Download raw data (including filtered results)
Reference structure matches:
| prototype | method | Ecoh (eV/atom) | Epot (eV/atom) | a0 (Å) | b0 (Å) | c0 (Å) | α (degrees) | β (degrees) | γ (degrees) |
|---|
| L2_1--AlCu2Mn--heusler | static | -1.771 | -1.771 | 7.3225 | 7.3225 | 7.3225 | 90.0 | 90.0 | 90.0 |
Download raw data (including filtered results)
Reference structure matches:
L2_1--AlCu2Mn--heusler = mp-1215427
| prototype | method | Ecoh (eV/atom) | Epot (eV/atom) | a0 (Å) | b0 (Å) | c0 (Å) | α (degrees) | β (degrees) | γ (degrees) |
|---|
| L2_1--AlCu2Mn--heusler | static | -1.8857 | -1.8857 | 7.1037 | 7.1037 | 7.1037 | 90.0 | 90.0 | 90.0 |
Download raw data (including filtered results)
Reference structure matches:
| prototype | method | Ecoh (eV/atom) | Epot (eV/atom) | a0 (Å) | b0 (Å) | c0 (Å) | α (degrees) | β (degrees) | γ (degrees) |
|---|
| L1_2--AuCu3 | static | -2.0475 | -2.0475 | 4.7095 | 4.7095 | 4.7095 | 90.0 | 90.0 | 90.0 |
| D0_3--BiF3 | static | -2.0256 | -2.0256 | 7.4161 | 7.4161 | 7.4161 | 90.0 | 90.0 | 90.0 |
| A15--Cr3Si | static | -1.6823 | -1.6823 | 5.8907 | 5.8907 | 5.8907 | 90.0 | 90.0 | 90.0 |
Download raw data (including filtered results)
Reference structure matches:
| prototype | method | Ecoh (eV/atom) | Epot (eV/atom) | a0 (Å) | b0 (Å) | c0 (Å) | α (degrees) | β (degrees) | γ (degrees) |
|---|
| L2_1--AlCu2Mn--heusler | static | -1.6696 | -1.6696 | 7.5705 | 7.5705 | 7.5705 | 90.0 | 90.0 | 90.0 |
Download raw data (including filtered results)
Reference structure matches:
| prototype | method | Ecoh (eV/atom) | Epot (eV/atom) | a0 (Å) | b0 (Å) | c0 (Å) | α (degrees) | β (degrees) | γ (degrees) |
|---|
| L2_1--AlCu2Mn--heusler | static | -1.3008 | -1.3008 | 6.9496 | 6.9496 | 6.9496 | 90.0 | 90.0 | 90.0 |
Download raw data (including filtered results)
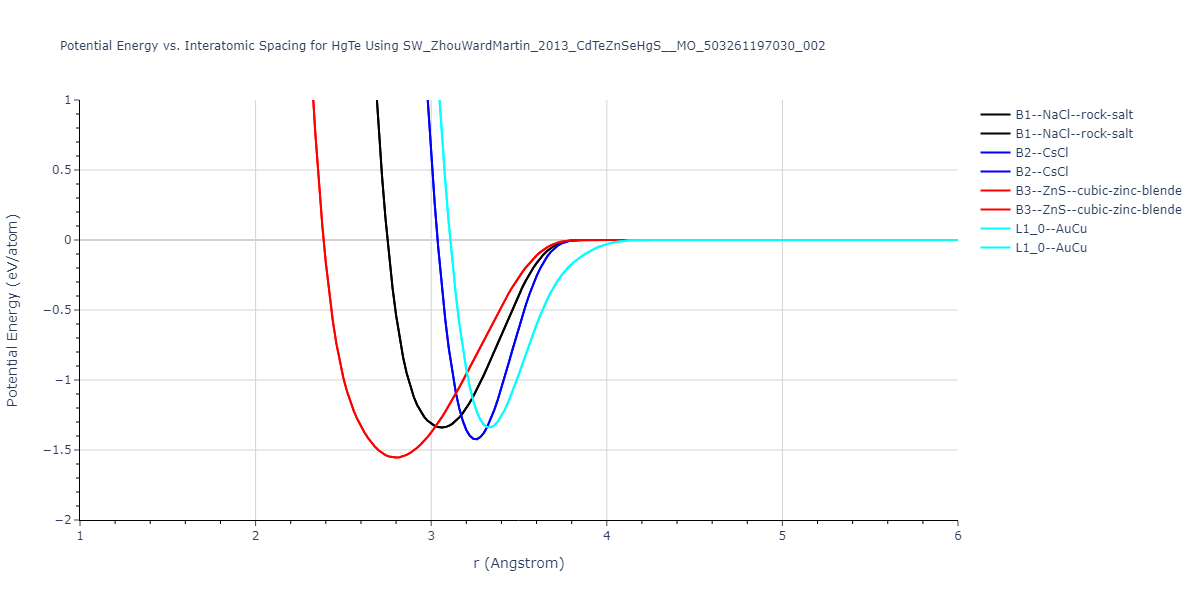
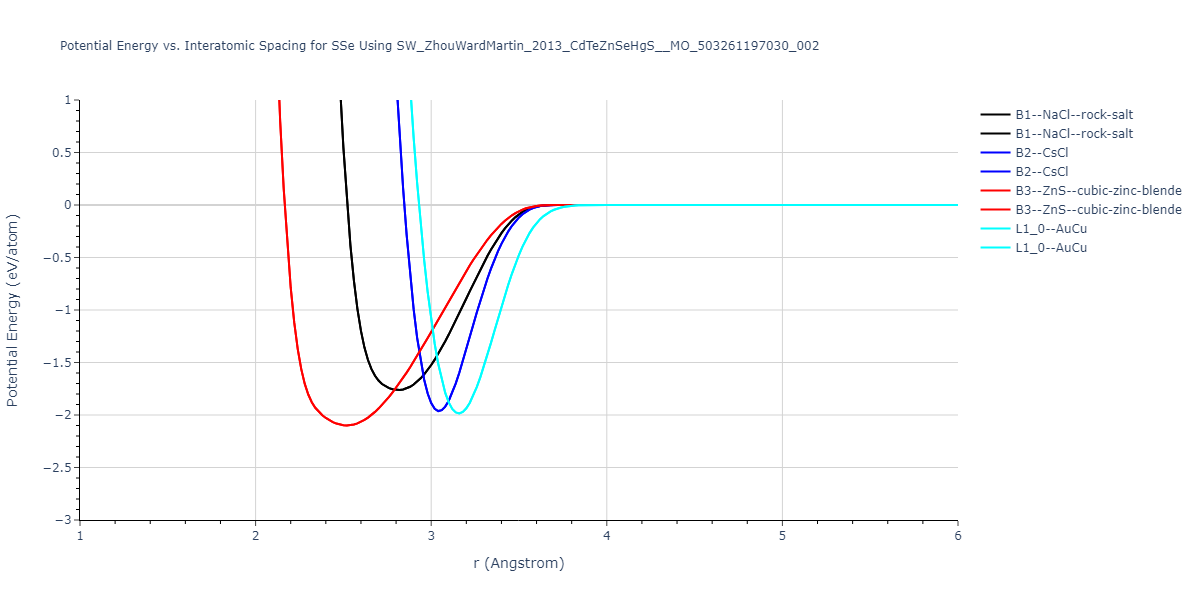
Reference structure matches:
B1--NaCl--rock-salt = mp-2388, oqmd-31332, oqmd-1106410
B2--CsCl = oqmd-307225
B3--ZnS--cubic-zinc-blende = mp-406, oqmd-6118, oqmd-1219111
L1_0--AuCu = oqmd-338767
| prototype | method | Ecoh (eV/atom) | Epot (eV/atom) | a0 (Å) | b0 (Å) | c0 (Å) | α (degrees) | β (degrees) | γ (degrees) |
|---|
| oqmd-19425 | dynamic | -2.178 | -2.178 | 4.5806 | 4.5806 | 7.4802 | 90.0 | 90.0 | 120.0 |
| B3--ZnS--cubic-zinc-blende | dynamic | -2.178 | -2.178 | 6.478 | 6.478 | 6.478 | 90.0 | 90.0 | 90.0 |
| oqmd-19425 | box | -2.178 | -2.178 | 4.5801 | 4.5801 | 7.4813 | 90.0 | 90.0 | 120.0 |
| B1--NaCl--rock-salt | static | -1.8089 | -1.8089 | 6.2694 | 6.2694 | 6.2694 | 90.0 | 90.0 | 90.0 |
| oqmd-23317 | box | -1.8064 | -1.8064 | 6.2658 | 6.2784 | 6.2347 | 90.0 | 90.0 | 90.0 |
| oqmd-122537 | box | -1.7959 | -1.7959 | 6.1372 | 6.5549 | 5.89 | 90.0 | 90.0 | 90.0 |
| oqmd-1228790 | static | -1.7955 | -1.7955 | 4.3357 | 4.3357 | 3.8731 | 90.0 | 90.0 | 120.0 |
| B2--CsCl | static | -1.7755 | -1.7755 | 3.8502 | 3.8502 | 3.8502 | 90.0 | 90.0 | 90.0 |
| oqmd-12385 | box | -1.775 | -1.775 | 4.4105 | 4.4105 | 10.8644 | 90.0 | 90.0 | 120.0 |
| oqmd-1219625 | box | -1.6904 | -1.6904 | 5.5898 | 3.6861 | 5.6334 | 90.0 | 90.0 | 90.0 |
| oqmd-18789 | box | -1.5148 | -1.5148 | 3.2959 | 5.7753 | 3.3554 | 90.0 | 90.0 | 90.0 |
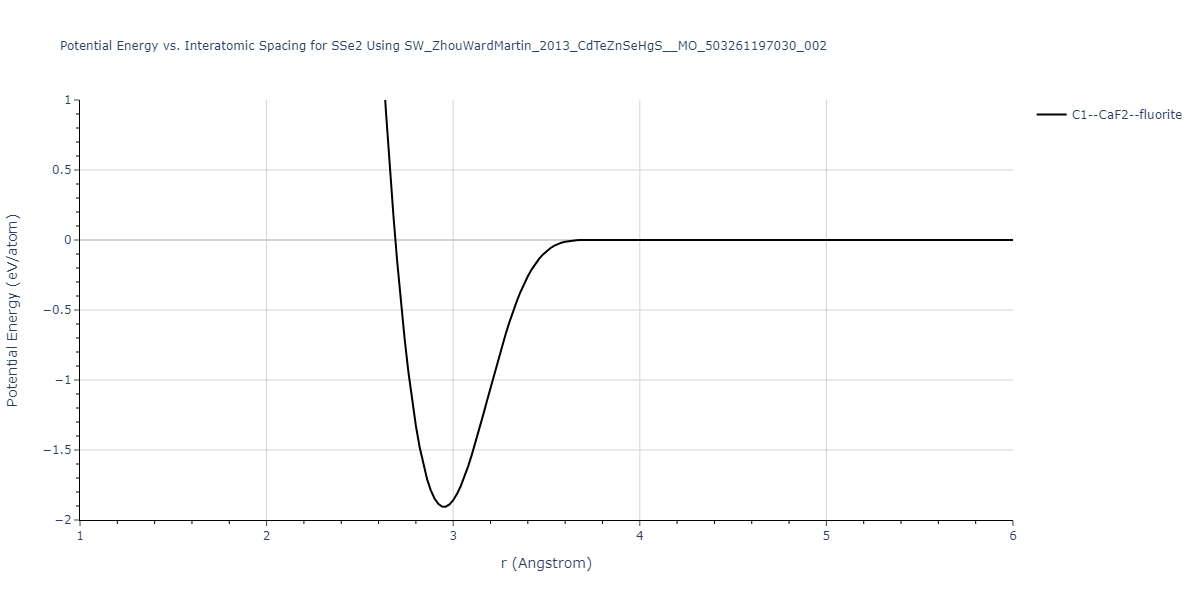
Download raw data (including filtered results)
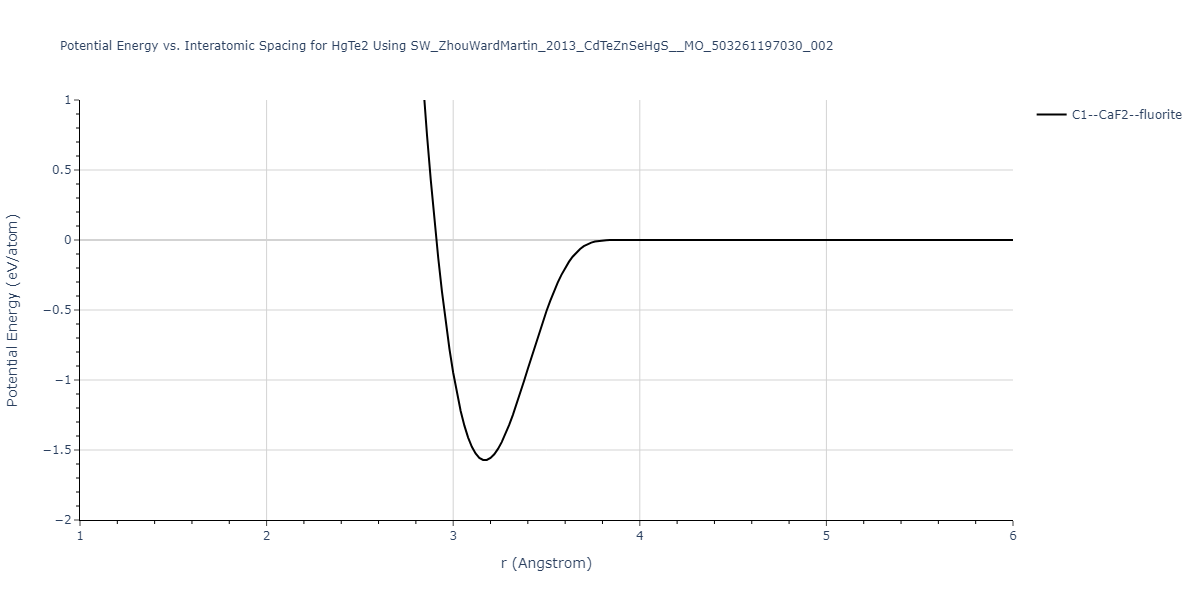
Reference structure matches:
| prototype | method | Ecoh (eV/atom) | Epot (eV/atom) | a0 (Å) | b0 (Å) | c0 (Å) | α (degrees) | β (degrees) | γ (degrees) |
|---|
| C1--CaF2--fluorite | static | -1.8551 | -1.8551 | 7.4526 | 7.4526 | 7.4526 | 90.0 | 90.0 | 90.0 |
| oqmd-1280882 | box | -1.6981 | -1.6981 | 7.3265 | 7.3265 | 7.3265 | 90.0 | 90.0 | 90.0 |
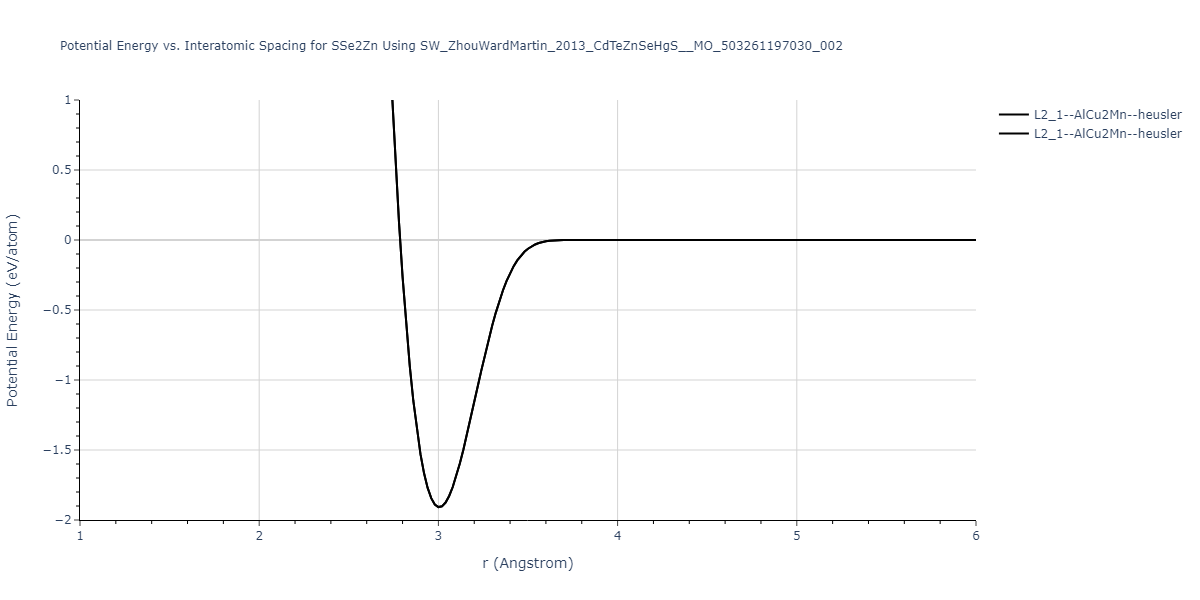
Download raw data (including filtered results)
Reference structure matches:
| prototype | method | Ecoh (eV/atom) | Epot (eV/atom) | a0 (Å) | b0 (Å) | c0 (Å) | α (degrees) | β (degrees) | γ (degrees) |
|---|
| L2_1--AlCu2Mn--heusler | static | -1.7435 | -1.7435 | 7.5183 | 7.5183 | 7.5183 | 90.0 | 90.0 | 90.0 |
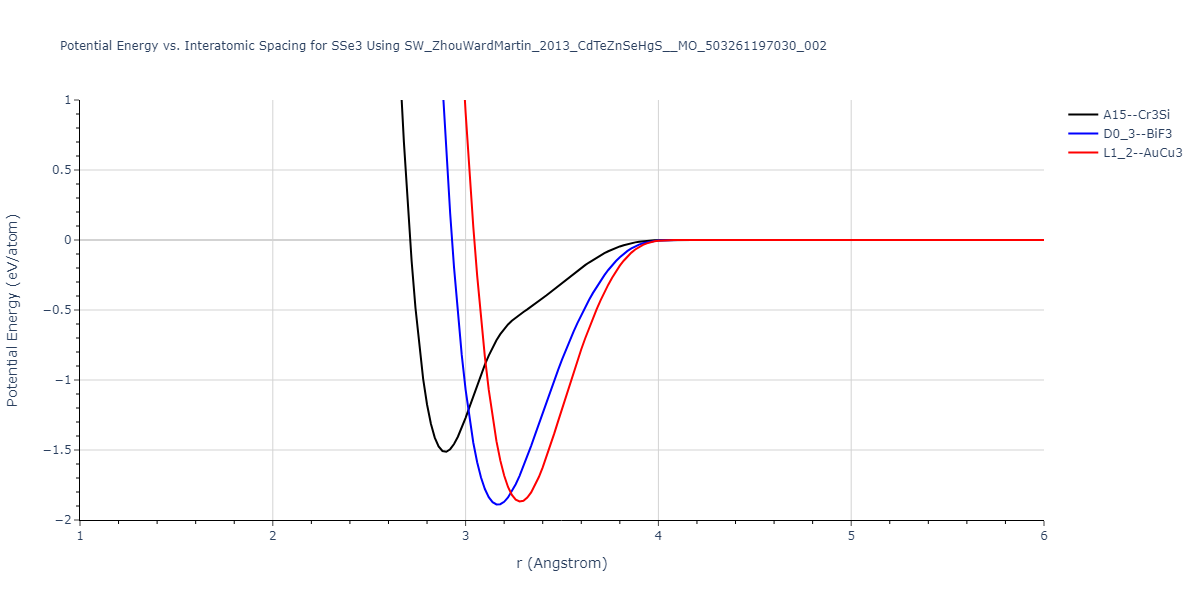
Download raw data (including filtered results)
Reference structure matches:
D0_3--BiF3 = oqmd-311756
L1_2--AuCu3 = oqmd-348626
| prototype | method | Ecoh (eV/atom) | Epot (eV/atom) | a0 (Å) | b0 (Å) | c0 (Å) | α (degrees) | β (degrees) | γ (degrees) |
|---|
| oqmd-324140 | static | -1.8884 | -1.8884 | 7.114 | 7.114 | 5.7376 | 90.0 | 90.0 | 120.0 |
| D0_3--BiF3 | static | -1.8833 | -1.8833 | 7.8934 | 7.8934 | 7.8934 | 90.0 | 90.0 | 90.0 |
| oqmd-301214 | static | -1.8793 | -1.8793 | 5.2919 | 5.2919 | 8.9203 | 90.0 | 90.0 | 90.0 |
| oqmd-301214 | box | -1.8784 | -1.8784 | 5.3871 | 5.3871 | 8.5523 | 90.0 | 90.0 | 90.0 |
| L1_2--AuCu3 | static | -1.856 | -1.856 | 5.0136 | 5.0136 | 5.0136 | 90.0 | 90.0 | 90.0 |
| oqmd-324140 | box | -1.8083 | -1.8083 | 7.1789 | 7.1789 | 5.6661 | 90.0 | 90.0 | 120.0 |
| A15--Cr3Si | static | -1.6214 | -1.6214 | 6.2582 | 6.2582 | 6.2582 | 90.0 | 90.0 | 90.0 |
Download raw data (including filtered results)
Reference structure matches:
| prototype | method | Ecoh (eV/atom) | Epot (eV/atom) | a0 (Å) | b0 (Å) | c0 (Å) | α (degrees) | β (degrees) | γ (degrees) |
|---|
| L2_1--AlCu2Mn--heusler | static | -1.3512 | -1.3512 | 7.2475 | 7.2475 | 7.2475 | 90.0 | 90.0 | 90.0 |
Download raw data (including filtered results)
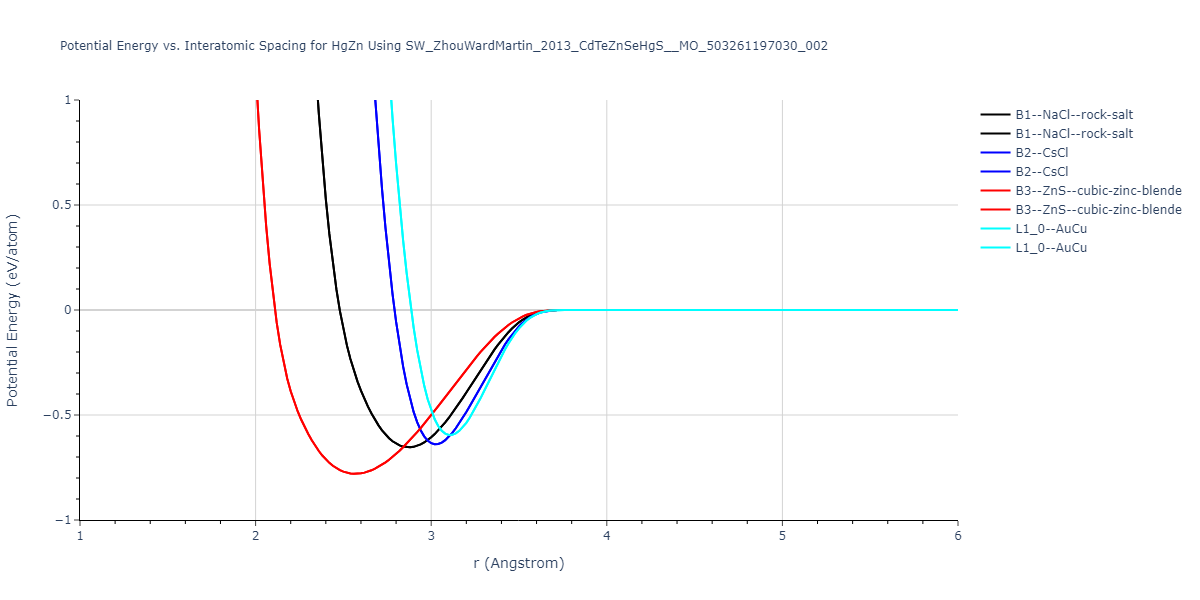
Reference structure matches:
| prototype | method | Ecoh (eV/atom) | Epot (eV/atom) | a0 (Å) | b0 (Å) | c0 (Å) | α (degrees) | β (degrees) | γ (degrees) |
|---|
| B3--ZnS--cubic-zinc-blende | dynamic | -0.98 | -0.98 | 6.29 | 6.29 | 6.29 | 90.0 | 90.0 | 90.0 |
| B1--NaCl--rock-salt | static | -0.8365 | -0.8365 | 6.0239 | 6.0239 | 6.0239 | 90.0 | 90.0 | 90.0 |
| L1_0--AuCu | static | -0.8208 | -0.8208 | 3.42 | 3.42 | 4.089 | 90.0 | 90.0 | 90.0 |
| L1_0--AuCu | box | -0.8184 | -0.8184 | 3.2779 | 3.2779 | 4.4184 | 90.0 | 90.0 | 90.0 |
| B2--CsCl | static | -0.8122 | -0.8122 | 3.6268 | 3.6268 | 3.6268 | 90.0 | 90.0 | 90.0 |
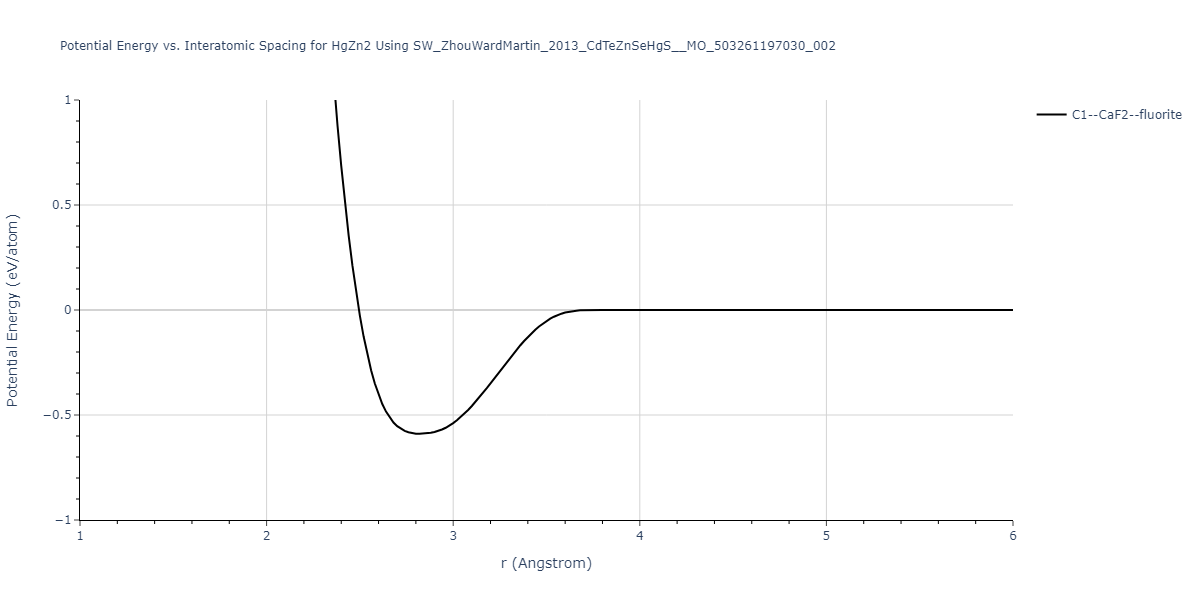
Download raw data (including filtered results)
Reference structure matches:
| prototype | method | Ecoh (eV/atom) | Epot (eV/atom) | a0 (Å) | b0 (Å) | c0 (Å) | α (degrees) | β (degrees) | γ (degrees) |
|---|
| C1--CaF2--fluorite | dynamic | -0.7436 | -0.7436 | 6.9558 | 6.9558 | 6.9558 | 90.0 | 90.0 | 90.0 |
Download raw data (including filtered results)
Reference structure matches:
| prototype | method | Ecoh (eV/atom) | Epot (eV/atom) | a0 (Å) | b0 (Å) | c0 (Å) | α (degrees) | β (degrees) | γ (degrees) |
|---|
| D0_3--BiF3 | static | -0.8039 | -0.8039 | 6.8967 | 6.8967 | 6.8967 | 90.0 | 90.0 | 90.0 |
| A15--Cr3Si | static | -0.7507 | -0.7507 | 5.6498 | 5.6498 | 5.6498 | 90.0 | 90.0 | 90.0 |
| L1_2--AuCu3 | box | -0.6726 | -0.6726 | 4.383 | 4.383 | 4.383 | 90.0 | 90.0 | 90.0 |
Download raw data (including filtered results)
Reference structure matches:
A1--Cu--fcc = mp-753304
A15--beta-W = mp-1184657
A3'--alpha-La--double-hcp = mp-1184709
A3--Mg--hcp = mp-1184554
A5--beta-Sn = mp-1184591
A6--In--bct = mp-569289, mp-1017981
| prototype | method | Ecoh (eV/atom) | Epot (eV/atom) | a0 (Å) | b0 (Å) | c0 (Å) | α (degrees) | β (degrees) | γ (degrees) |
|---|
| A3'--alpha-La--double-hcp | box | -0.606 | -0.606 | 3.264 | 3.264 | 10.6602 | 90.0 | 90.0 | 120.0 |
| A3--Mg--hcp | dynamic | -0.606 | -0.606 | 3.264 | 3.264 | 5.3301 | 90.0 | 90.0 | 120.0 |
| A1--Cu--fcc | dynamic | -0.606 | -0.606 | 4.616 | 4.616 | 4.616 | 90.0 | 90.0 | 90.0 |
| A2--W--bcc | static | -0.508 | -0.508 | 3.6905 | 3.6905 | 3.6905 | 90.0 | 90.0 | 90.0 |
| Ah--alpha-Po--sc | dynamic | -0.435 | -0.435 | 3.1616 | 3.1616 | 3.1616 | 90.0 | 90.0 | 90.0 |
| A5--beta-Sn | dynamic | -0.4345 | -0.4345 | 6.1026 | 6.1026 | 3.1801 | 90.0 | 90.0 | 90.0 |
| A15--beta-W | static | -0.3694 | -0.3694 | 5.8821 | 5.8821 | 5.8821 | 90.0 | 90.0 | 90.0 |
| A4--C--dc | dynamic | -0.3515 | -0.3515 | 7.1514 | 7.1514 | 7.1514 | 90.0 | 90.0 | 90.0 |
Download raw data (including filtered results)
Reference structure matches:
| prototype | method | Ecoh (eV/atom) | Epot (eV/atom) | a0 (Å) | b0 (Å) | c0 (Å) | α (degrees) | β (degrees) | γ (degrees) |
|---|
| C1--CaF2--fluorite | static | -1.4815 | -1.4815 | 6.6121 | 6.6121 | 6.6121 | 90.0 | 90.0 | 90.0 |
Download raw data (including filtered results)
Reference structure matches:
| prototype | method | Ecoh (eV/atom) | Epot (eV/atom) | a0 (Å) | b0 (Å) | c0 (Å) | α (degrees) | β (degrees) | γ (degrees) |
|---|
| L2_1--AlCu2Mn--heusler | static | -1.5372 | -1.5372 | 6.8913 | 6.8913 | 6.8913 | 90.0 | 90.0 | 90.0 |
Download raw data (including filtered results)
Reference structure matches:
| prototype | method | Ecoh (eV/atom) | Epot (eV/atom) | a0 (Å) | b0 (Å) | c0 (Å) | α (degrees) | β (degrees) | γ (degrees) |
|---|
| L2_1--AlCu2Mn--heusler | static | -1.3448 | -1.3448 | 7.055 | 7.055 | 7.055 | 90.0 | 90.0 | 90.0 |
Download raw data (including filtered results)
Reference structure matches:
| prototype | method | Ecoh (eV/atom) | Epot (eV/atom) | a0 (Å) | b0 (Å) | c0 (Å) | α (degrees) | β (degrees) | γ (degrees) |
|---|
| L2_1--AlCu2Mn--heusler | static | -1.1114 | -1.1114 | 6.8287 | 6.8287 | 6.8287 | 90.0 | 90.0 | 90.0 |
Download raw data (including filtered results)
Reference structure matches:
| prototype | method | Ecoh (eV/atom) | Epot (eV/atom) | a0 (Å) | b0 (Å) | c0 (Å) | α (degrees) | β (degrees) | γ (degrees) |
|---|
| C1--CaF2--fluorite | dynamic | -1.3449 | -1.3449 | 6.786 | 6.786 | 6.786 | 90.0 | 90.0 | 90.0 |
Download raw data (including filtered results)
Reference structure matches:
| prototype | method | Ecoh (eV/atom) | Epot (eV/atom) | a0 (Å) | b0 (Å) | c0 (Å) | α (degrees) | β (degrees) | γ (degrees) |
|---|
| L2_1--AlCu2Mn--heusler | static | -1.347 | -1.347 | 7.1868 | 7.1868 | 7.1868 | 90.0 | 90.0 | 90.0 |
Download raw data (including filtered results)
Reference structure matches:
| prototype | method | Ecoh (eV/atom) | Epot (eV/atom) | a0 (Å) | b0 (Å) | c0 (Å) | α (degrees) | β (degrees) | γ (degrees) |
|---|
| L2_1--AlCu2Mn--heusler | static | -1.0641 | -1.0641 | 6.9784 | 6.9784 | 6.9784 | 90.0 | 90.0 | 90.0 |
Download raw data (including filtered results)
Reference structure matches:
| prototype | method | Ecoh (eV/atom) | Epot (eV/atom) | a0 (Å) | b0 (Å) | c0 (Å) | α (degrees) | β (degrees) | γ (degrees) |
|---|
| C1--CaF2--fluorite | dynamic | -1.2115 | -1.2115 | 7.0725 | 7.0725 | 7.0725 | 90.0 | 90.0 | 90.0 |
Download raw data (including filtered results)
Reference structure matches:
| prototype | method | Ecoh (eV/atom) | Epot (eV/atom) | a0 (Å) | b0 (Å) | c0 (Å) | α (degrees) | β (degrees) | γ (degrees) |
|---|
| L2_1--AlCu2Mn--heusler | static | -1.0139 | -1.0139 | 7.1875 | 7.1875 | 7.1875 | 90.0 | 90.0 | 90.0 |
Download raw data (including filtered results)
Reference structure matches:
| prototype | method | Ecoh (eV/atom) | Epot (eV/atom) | a0 (Å) | b0 (Å) | c0 (Å) | α (degrees) | β (degrees) | γ (degrees) |
|---|
| C1--CaF2--fluorite | dynamic | -0.6456 | -0.6456 | 6.7398 | 6.7398 | 6.7398 | 90.0 | 90.0 | 90.0 |
Download raw data (including filtered results)
Reference structure matches:
| prototype | method | Ecoh (eV/atom) | Epot (eV/atom) | a0 (Å) | b0 (Å) | c0 (Å) | α (degrees) | β (degrees) | γ (degrees) |
|---|
| L1_2--AuCu3 | static | -0.8465 | -0.8465 | 4.4237 | 4.4237 | 4.4237 | 90.0 | 90.0 | 90.0 |
| D0_3--BiF3 | static | -0.8225 | -0.8225 | 7.0285 | 7.0285 | 7.0285 | 90.0 | 90.0 | 90.0 |
| A15--Cr3Si | static | -0.6371 | -0.6371 | 5.538 | 5.538 | 5.538 | 90.0 | 90.0 | 90.0 |
Download raw data (including filtered results)
Reference structure matches:
| prototype | method | Ecoh (eV/atom) | Epot (eV/atom) | a0 (Å) | b0 (Å) | c0 (Å) | α (degrees) | β (degrees) | γ (degrees) |
|---|
| L1_2--AuCu3 | static | -0.9611 | -0.9611 | 4.512 | 4.512 | 4.512 | 90.0 | 90.0 | 90.0 |
| D0_3--BiF3 | static | -0.8983 | -0.8983 | 7.1464 | 7.1464 | 7.1464 | 90.0 | 90.0 | 90.0 |
| A15--Cr3Si | static | -0.7406 | -0.7406 | 5.6666 | 5.6666 | 5.6666 | 90.0 | 90.0 | 90.0 |
Download raw data (including filtered results)
Reference structure matches:
| prototype | method | Ecoh (eV/atom) | Epot (eV/atom) | a0 (Å) | b0 (Å) | c0 (Å) | α (degrees) | β (degrees) | γ (degrees) |
|---|
| L1_2--AuCu3 | static | -1.0105 | -1.0105 | 4.6397 | 4.6397 | 4.6397 | 90.0 | 90.0 | 90.0 |
| D0_3--BiF3 | static | -0.9626 | -0.9626 | 7.3278 | 7.3278 | 7.3278 | 90.0 | 90.0 | 90.0 |
| A15--Cr3Si | static | -0.821 | -0.821 | 5.865 | 5.865 | 5.865 | 90.0 | 90.0 | 90.0 |
Download raw data (including filtered results)
Reference structure matches:
D0_3--BiF3 = mp-971757
L1_2--AuCu3 = mp-971803
| prototype | method | Ecoh (eV/atom) | Epot (eV/atom) | a0 (Å) | b0 (Å) | c0 (Å) | α (degrees) | β (degrees) | γ (degrees) |
|---|
| L1_2--AuCu3 | static | -0.5828 | -0.5828 | 4.5604 | 4.5604 | 4.5604 | 90.0 | 90.0 | 90.0 |
| D0_3--BiF3 | static | -0.5229 | -0.5229 | 7.2376 | 7.2376 | 7.2376 | 90.0 | 90.0 | 90.0 |
| A15--Cr3Si | static | -0.3271 | -0.3271 | 5.769 | 5.769 | 5.769 | 90.0 | 90.0 | 90.0 |
Download raw data (including filtered results)
Reference structure matches:
B1--NaCl--rock-salt = mp-10764
B3--ZnS--cubic-zinc-blende = mp-1123
| prototype | method | Ecoh (eV/atom) | Epot (eV/atom) | a0 (Å) | b0 (Å) | c0 (Å) | α (degrees) | β (degrees) | γ (degrees) |
|---|
| B3--ZnS--cubic-zinc-blende | dynamic | -2.004 | -2.004 | 5.858 | 5.858 | 5.858 | 90.0 | 90.0 | 90.0 |
| B2--CsCl | static | -1.8532 | -1.8532 | 3.4303 | 3.4303 | 3.4303 | 90.0 | 90.0 | 90.0 |
| B1--NaCl--rock-salt | static | -1.7389 | -1.7389 | 5.5656 | 5.5656 | 5.5656 | 90.0 | 90.0 | 90.0 |
Download raw data (including filtered results)
Reference structure matches:
| prototype | method | Ecoh (eV/atom) | Epot (eV/atom) | a0 (Å) | b0 (Å) | c0 (Å) | α (degrees) | β (degrees) | γ (degrees) |
|---|
| C1--CaF2--fluorite | static | -2.0555 | -2.0555 | 6.6602 | 6.6602 | 6.6602 | 90.0 | 90.0 | 90.0 |
Download raw data (including filtered results)
Reference structure matches:
| prototype | method | Ecoh (eV/atom) | Epot (eV/atom) | a0 (Å) | b0 (Å) | c0 (Å) | α (degrees) | β (degrees) | γ (degrees) |
|---|
| L2_1--AlCu2Mn--heusler | static | -1.8516 | -1.8516 | 6.8965 | 6.8965 | 6.8965 | 90.0 | 90.0 | 90.0 |
Download raw data (including filtered results)
Reference structure matches:
| prototype | method | Ecoh (eV/atom) | Epot (eV/atom) | a0 (Å) | b0 (Å) | c0 (Å) | α (degrees) | β (degrees) | γ (degrees) |
|---|
| L2_1--AlCu2Mn--heusler | static | -1.83 | -1.83 | 6.9833 | 6.9833 | 6.9833 | 90.0 | 90.0 | 90.0 |
Download raw data (including filtered results)
Reference structure matches:
| prototype | method | Ecoh (eV/atom) | Epot (eV/atom) | a0 (Å) | b0 (Å) | c0 (Å) | α (degrees) | β (degrees) | γ (degrees) |
|---|
| L2_1--AlCu2Mn--heusler | static | -2.131 | -2.131 | 6.7625 | 6.7625 | 6.7625 | 90.0 | 90.0 | 90.0 |
Download raw data (including filtered results)
Reference structure matches:
| prototype | method | Ecoh (eV/atom) | Epot (eV/atom) | a0 (Å) | b0 (Å) | c0 (Å) | α (degrees) | β (degrees) | γ (degrees) |
|---|
| D0_3--BiF3 | dynamic | -2.2184 | -2.2184 | 7.1377 | 7.1377 | 7.1377 | 90.0 | 90.0 | 90.0 |
| L1_2--AuCu3 | static | -2.1153 | -2.1153 | 4.5364 | 4.5364 | 4.5364 | 90.0 | 90.0 | 90.0 |
| A15--Cr3Si | box | -1.7523 | -1.7523 | 5.6383 | 5.6383 | 5.6383 | 90.0 | 90.0 | 90.0 |
Download raw data (including filtered results)
Reference structure matches:
| prototype | method | Ecoh (eV/atom) | Epot (eV/atom) | a0 (Å) | b0 (Å) | c0 (Å) | α (degrees) | β (degrees) | γ (degrees) |
|---|
| L2_1--AlCu2Mn--heusler | static | -1.6767 | -1.6767 | 7.0479 | 7.0479 | 7.0479 | 90.0 | 90.0 | 90.0 |
Download raw data (including filtered results)
Reference structure matches:
| prototype | method | Ecoh (eV/atom) | Epot (eV/atom) | a0 (Å) | b0 (Å) | c0 (Å) | α (degrees) | β (degrees) | γ (degrees) |
|---|
| L2_1--AlCu2Mn--heusler | static | -1.5282 | -1.5282 | 7.4067 | 7.4067 | 7.4067 | 90.0 | 90.0 | 90.0 |
Download raw data (including filtered results)
Reference structure matches:
| prototype | method | Ecoh (eV/atom) | Epot (eV/atom) | a0 (Å) | b0 (Å) | c0 (Å) | α (degrees) | β (degrees) | γ (degrees) |
|---|
| L2_1--AlCu2Mn--heusler | static | -1.5041 | -1.5041 | 6.5268 | 6.5268 | 6.5268 | 90.0 | 90.0 | 90.0 |
Download raw data (including filtered results)
Reference structure matches:
B1--NaCl--rock-salt = mp-957
B3--ZnS--cubic-zinc-blende = mp-820
| prototype | method | Ecoh (eV/atom) | Epot (eV/atom) | a0 (Å) | b0 (Å) | c0 (Å) | α (degrees) | β (degrees) | γ (degrees) |
|---|
| B3--ZnS--cubic-zinc-blende | dynamic | -1.738 | -1.738 | 6.084 | 6.084 | 6.084 | 90.0 | 90.0 | 90.0 |
| B2--CsCl | static | -1.6042 | -1.6042 | 3.5414 | 3.5414 | 3.5414 | 90.0 | 90.0 | 90.0 |
| B1--NaCl--rock-salt | static | -1.5004 | -1.5004 | 5.7932 | 5.7932 | 5.7932 | 90.0 | 90.0 | 90.0 |
Download raw data (including filtered results)
Reference structure matches:
| prototype | method | Ecoh (eV/atom) | Epot (eV/atom) | a0 (Å) | b0 (Å) | c0 (Å) | α (degrees) | β (degrees) | γ (degrees) |
|---|
| C1--CaF2--fluorite | static | -1.7385 | -1.7385 | 6.8748 | 6.8748 | 6.8748 | 90.0 | 90.0 | 90.0 |
Download raw data (including filtered results)
Reference structure matches:
| prototype | method | Ecoh (eV/atom) | Epot (eV/atom) | a0 (Å) | b0 (Å) | c0 (Å) | α (degrees) | β (degrees) | γ (degrees) |
|---|
| L2_1--AlCu2Mn--heusler | static | -1.6142 | -1.6142 | 7.182 | 7.182 | 7.182 | 90.0 | 90.0 | 90.0 |
Download raw data (including filtered results)
Reference structure matches:
| prototype | method | Ecoh (eV/atom) | Epot (eV/atom) | a0 (Å) | b0 (Å) | c0 (Å) | α (degrees) | β (degrees) | γ (degrees) |
|---|
| L2_1--AlCu2Mn--heusler | static | -1.7982 | -1.7982 | 6.9816 | 6.9816 | 6.9816 | 90.0 | 90.0 | 90.0 |
Download raw data (including filtered results)
Reference structure matches:
| prototype | method | Ecoh (eV/atom) | Epot (eV/atom) | a0 (Å) | b0 (Å) | c0 (Å) | α (degrees) | β (degrees) | γ (degrees) |
|---|
| D0_3--BiF3 | static | -1.8475 | -1.8475 | 7.3373 | 7.3373 | 7.3373 | 90.0 | 90.0 | 90.0 |
| L1_2--AuCu3 | static | -1.838 | -1.838 | 4.6523 | 4.6523 | 4.6523 | 90.0 | 90.0 | 90.0 |
| A15--Cr3Si | static | -1.4709 | -1.4709 | 5.8028 | 5.8028 | 5.8028 | 90.0 | 90.0 | 90.0 |
Download raw data (including filtered results)
Reference structure matches:
| prototype | method | Ecoh (eV/atom) | Epot (eV/atom) | a0 (Å) | b0 (Å) | c0 (Å) | α (degrees) | β (degrees) | γ (degrees) |
|---|
| L2_1--AlCu2Mn--heusler | static | -1.4981 | -1.4981 | 7.4748 | 7.4748 | 7.4748 | 90.0 | 90.0 | 90.0 |
Download raw data (including filtered results)
Reference structure matches:
| prototype | method | Ecoh (eV/atom) | Epot (eV/atom) | a0 (Å) | b0 (Å) | c0 (Å) | α (degrees) | β (degrees) | γ (degrees) |
|---|
| L2_1--AlCu2Mn--heusler | static | -1.347 | -1.347 | 6.768 | 6.768 | 6.768 | 90.0 | 90.0 | 90.0 |
Download raw data (including filtered results)
Reference structure matches:
B1--NaCl--rock-salt = mp-1811
B2--CsCl = mp-13141
B3--ZnS--cubic-zinc-blende = mp-2730
| prototype | method | Ecoh (eV/atom) | Epot (eV/atom) | a0 (Å) | b0 (Å) | c0 (Å) | α (degrees) | β (degrees) | γ (degrees) |
|---|
| B3--ZnS--cubic-zinc-blende | dynamic | -1.554 | -1.554 | 6.46 | 6.46 | 6.46 | 90.0 | 90.0 | 90.0 |
| B2--CsCl | static | -1.4239 | -1.4239 | 3.7556 | 3.7556 | 3.7556 | 90.0 | 90.0 | 90.0 |
| B1--NaCl--rock-salt | static | -1.3393 | -1.3393 | 6.1196 | 6.1196 | 6.1196 | 90.0 | 90.0 | 90.0 |
Download raw data (including filtered results)
Reference structure matches:
| prototype | method | Ecoh (eV/atom) | Epot (eV/atom) | a0 (Å) | b0 (Å) | c0 (Å) | α (degrees) | β (degrees) | γ (degrees) |
|---|
| C1--CaF2--fluorite | static | -1.5728 | -1.5728 | 7.3205 | 7.3205 | 7.3205 | 90.0 | 90.0 | 90.0 |
Download raw data (including filtered results)
Reference structure matches:
| prototype | method | Ecoh (eV/atom) | Epot (eV/atom) | a0 (Å) | b0 (Å) | c0 (Å) | α (degrees) | β (degrees) | γ (degrees) |
|---|
| L2_1--AlCu2Mn--heusler | static | -1.5931 | -1.5931 | 7.4249 | 7.4249 | 7.4249 | 90.0 | 90.0 | 90.0 |
Download raw data (including filtered results)
Reference structure matches:
| prototype | method | Ecoh (eV/atom) | Epot (eV/atom) | a0 (Å) | b0 (Å) | c0 (Å) | α (degrees) | β (degrees) | γ (degrees) |
|---|
| D0_3--BiF3 | dynamic | -1.6893 | -1.6893 | 7.8181 | 7.8181 | 7.8181 | 90.0 | 90.0 | 90.0 |
| L1_2--AuCu3 | static | -1.6055 | -1.6055 | 4.9602 | 4.9602 | 4.9602 | 90.0 | 90.0 | 90.0 |
| A15--Cr3Si | static | -1.3774 | -1.3774 | 6.174 | 6.174 | 6.174 | 90.0 | 90.0 | 90.0 |
Download raw data (including filtered results)
Reference structure matches:
| prototype | method | Ecoh (eV/atom) | Epot (eV/atom) | a0 (Å) | b0 (Å) | c0 (Å) | α (degrees) | β (degrees) | γ (degrees) |
|---|
| L2_1--AlCu2Mn--heusler | static | -1.3204 | -1.3204 | 7.0831 | 7.0831 | 7.0831 | 90.0 | 90.0 | 90.0 |
Download raw data (including filtered results)
Reference structure matches:
| prototype | method | Ecoh (eV/atom) | Epot (eV/atom) | a0 (Å) | b0 (Å) | c0 (Å) | α (degrees) | β (degrees) | γ (degrees) |
|---|
| B3--ZnS--cubic-zinc-blende | dynamic | -0.78 | -0.78 | 5.93 | 5.93 | 5.93 | 90.0 | 90.0 | 90.0 |
| B1--NaCl--rock-salt | static | -0.6539 | -0.6539 | 5.7448 | 5.7448 | 5.7448 | 90.0 | 90.0 | 90.0 |
| B2--CsCl | static | -0.6396 | -0.6396 | 3.4939 | 3.4939 | 3.4939 | 90.0 | 90.0 | 90.0 |
Download raw data (including filtered results)
Reference structure matches:
| prototype | method | Ecoh (eV/atom) | Epot (eV/atom) | a0 (Å) | b0 (Å) | c0 (Å) | α (degrees) | β (degrees) | γ (degrees) |
|---|
| C1--CaF2--fluorite | static | -0.5895 | -0.5895 | 6.5183 | 6.5183 | 6.5183 | 90.0 | 90.0 | 90.0 |
Download raw data (including filtered results)
Reference structure matches:
| prototype | method | Ecoh (eV/atom) | Epot (eV/atom) | a0 (Å) | b0 (Å) | c0 (Å) | α (degrees) | β (degrees) | γ (degrees) |
|---|
| D0_3--BiF3 | static | -0.7975 | -0.7975 | 6.6652 | 6.6652 | 6.6652 | 90.0 | 90.0 | 90.0 |
| L1_2--AuCu3 | static | -0.7413 | -0.7413 | 4.2082 | 4.2082 | 4.2082 | 90.0 | 90.0 | 90.0 |
| A15--Cr3Si | static | -0.6531 | -0.6531 | 5.4519 | 5.4519 | 5.4519 | 90.0 | 90.0 | 90.0 |
Download raw data (including filtered results)
Reference structure matches:
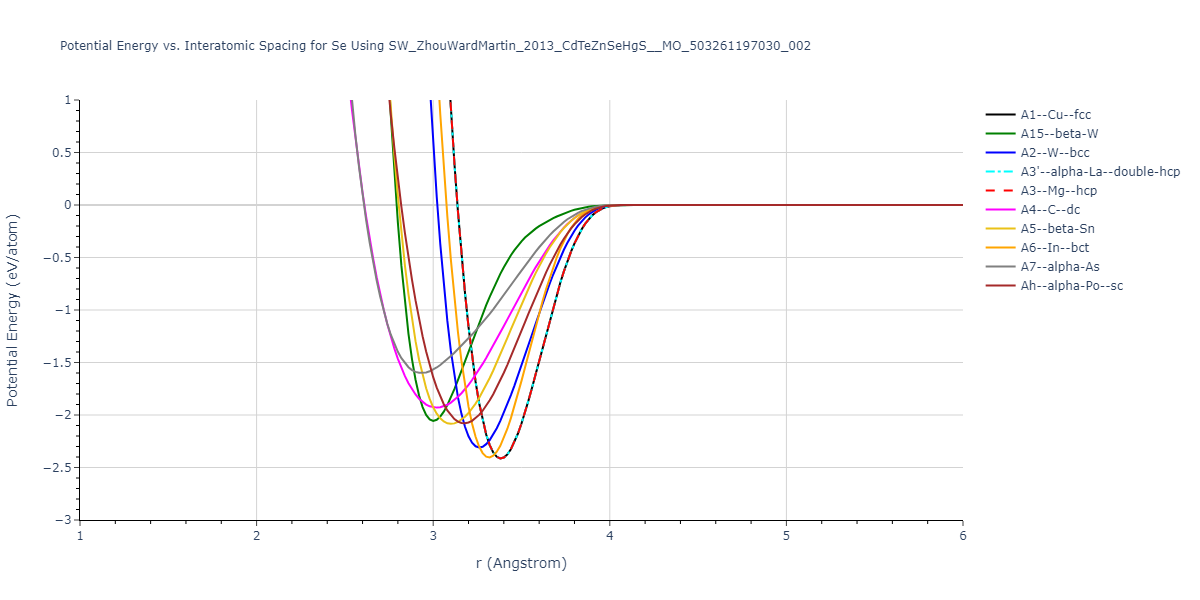
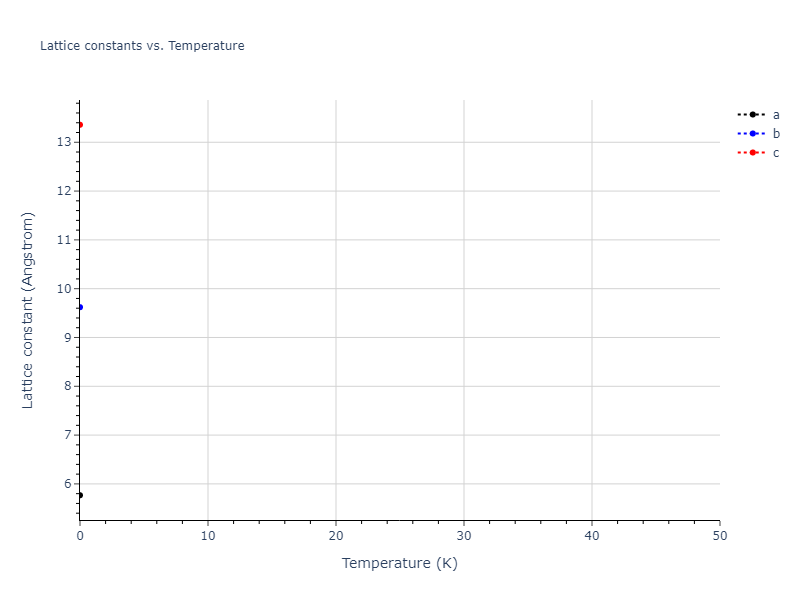
A1--Cu--fcc = mp-684673, oqmd-1214566
A15--beta-W = oqmd-1215011
A2--W--bcc = oqmd-676672, oqmd-1215189
A3'--alpha-La--double-hcp = oqmd-1215457
A3--Mg--hcp = oqmd-1215367
A4--C--dc = oqmd-1215546
A5--beta-Sn = oqmd-1215635
A6--In--bct = mp-1063988, oqmd-1215724
Ah--alpha-Po--sc = mp-10869
| prototype | method | Ecoh (eV/atom) | Epot (eV/atom) | a0 (Å) | b0 (Å) | c0 (Å) | α (degrees) | β (degrees) | γ (degrees) |
|---|
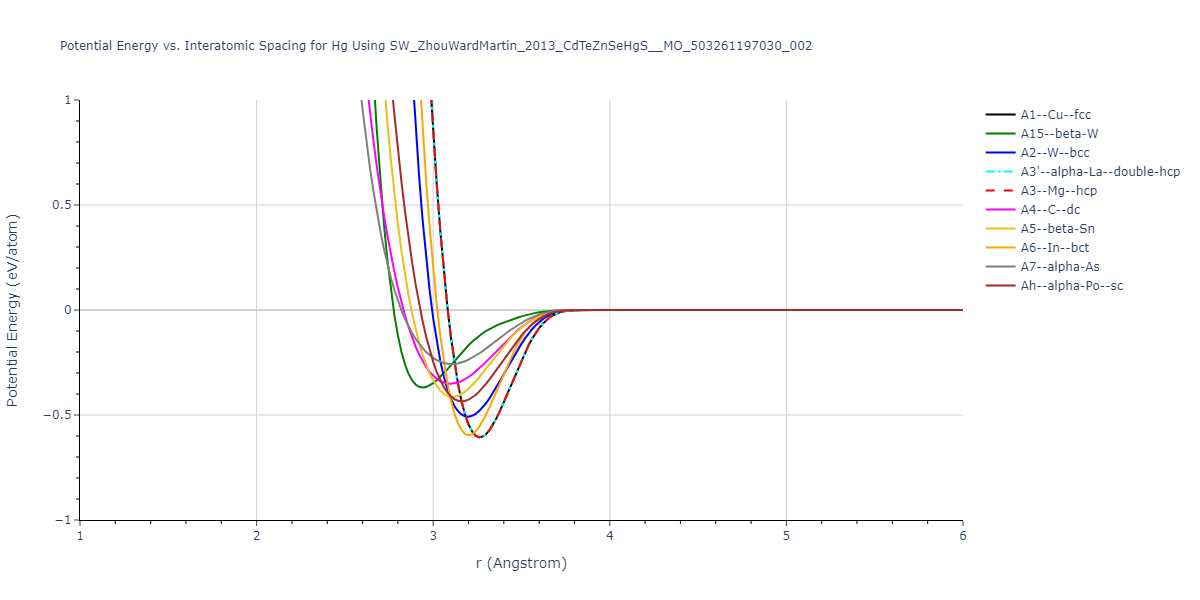
| A1--Cu--fcc | dynamic | -2.845 | -2.845 | 4.686 | 4.686 | 4.686 | 90.0 | 90.0 | 90.0 |
| A3'--alpha-La--double-hcp | dynamic | -2.845 | -2.845 | 3.3135 | 3.3135 | 10.8219 | 90.0 | 90.0 | 120.0 |
| A3--Mg--hcp | box | -2.845 | -2.845 | 3.3135 | 3.3135 | 5.4109 | 90.0 | 90.0 | 120.0 |
| oqmd-1216083 | dynamic | -2.845 | -2.845 | 3.3135 | 3.3135 | 24.3492 | 90.0 | 90.0 | 120.0 |
| A2--W--bcc | dynamic | -2.79 | -2.79 | 3.6839 | 3.6839 | 3.6839 | 90.0 | 90.0 | 90.0 |
| oqmd-1214922 | dynamic | -2.7323 | -2.7323 | 8.124 | 8.124 | 8.124 | 90.0 | 90.0 | 90.0 |
| A3--Mg--hcp | dynamic | -2.7151 | -2.7151 | 4.4526 | 4.4526 | 3.5046 | 90.0 | 90.0 | 120.0 |
| A4--C--dc | dynamic | -2.6962 | -2.6962 | 6.6605 | 6.6605 | 6.6605 | 90.0 | 90.0 | 90.0 |
| A5--beta-Sn | static | -2.6899 | -2.6899 | 5.8697 | 5.8697 | 3.1436 | 90.0 | 90.0 | 90.0 |
| A3'--alpha-La--double-hcp | dynamic | -2.6851 | -2.6851 | 4.3985 | 4.3985 | 7.0759 | 90.0 | 90.0 | 120.0 |
| oqmd-1214744 | dynamic | -2.6799 | -2.6799 | 5.4065 | 8.1997 | 5.6452 | 90.0 | 90.0 | 90.0 |
| Ah--alpha-Po--sc | dynamic | -2.6602 | -2.6602 | 3.0844 | 3.0844 | 3.0844 | 90.0 | 90.0 | 90.0 |
| oqmd-3213 | dynamic | -2.6322 | -2.6322 | 7.2151 | 12.8576 | 22.9 | 90.0 | 90.0 | 90.0 |
| oqmd-5012 | dynamic | -2.6078 | -2.6078 | 5.7675 | 9.6204 | 13.3589 | 90.0 | 90.0 | 90.0 |
| oqmd-6968 | dynamic | -2.5896 | -2.5896 | 21.5702 | 10.1864 | 9.1547 | 90.0 | 100.1 | 90.0 |
| oqmd-3448 | dynamic | -2.5806 | -2.5806 | 14.9657 | 7.0958 | 21.0511 | 90.0 | 130.7 | 90.0 |
| oqmd-11535 | dynamic | -2.5736 | -2.5736 | 16.5931 | 9.1002 | 18.5894 | 90.0 | 90.0 | 90.0 |
| oqmd-11536 | dynamic | -2.569 | -2.569 | 13.6862 | 13.2522 | 18.9514 | 90.0 | 105.7 | 90.0 |
| oqmd-675622 | dynamic | -2.5611 | -2.5611 | 11.3894 | 11.9132 | 11.4904 | 90.0 | 97.4 | 90.0 |
| oqmd-1214833 | dynamic | -2.5142 | -2.5142 | 12.3774 | 12.3774 | 12.3774 | 90.0 | 90.0 | 90.0 |
| oqmd-3214 | dynamic | -2.5102 | -2.5102 | 22.5141 | 12.9842 | 9.0906 | 90.0 | 90.0 | 90.0 |
| A7--alpha-As | box | -2.4873 | -2.4873 | 4.618 | 4.618 | 9.4339 | 90.0 | 90.0 | 120.0 |
| oqmd-5346 | dynamic | -2.4863 | -2.4863 | 11.9739 | 11.9739 | 5.1755 | 90.0 | 90.0 | 120.0 |
| A15--beta-W | static | -2.4758 | -2.4758 | 5.8715 | 5.8715 | 5.8715 | 90.0 | 90.0 | 90.0 |
| oqmd-2392 | dynamic | -2.4584 | -2.4584 | 11.982 | 7.7678 | 17.2271 | 90.0 | 132.9 | 90.0 |
| oqmd-1215100 | box | -2.3168 | -2.3168 | 3.7479 | 4.8859 | 16.1593 | 90.0 | 90.0 | 90.0 |
| oqmd-1216083 | static | -2.064 | -2.064 | 4.4942 | 4.4942 | 21.0284 | 90.0 | 90.0 | 120.0 |
| oqmd-1214744 | box | -1.9954 | -1.9954 | 4.5971 | 12.7308 | 5.5318 | 90.0 | 90.0 | 90.0 |
| A6--In--bct | dynamic | -1.9359 | -1.9359 | 3.0448 | 3.0448 | 7.2869 | 90.0 | 90.0 | 90.0 |
| A6--In--bct | static | -1.9359 | -1.9359 | 3.0448 | 3.0448 | 7.278 | 90.0 | 90.0 | 90.0 |
| oqmd-1216083 | box | -1.8204 | -1.8204 | 3.79 | 3.79 | 28.9401 | 90.0 | 90.0 | 120.0 |
| oqmd-1214922 | box | -1.6107 | -1.6107 | 11.0645 | 11.0645 | 11.0645 | 90.0 | 90.0 | 90.0 |
| oqmd-3214 | box | -1.4736 | -1.4736 | 30.0854 | 24.4178 | 5.7165 | 90.0 | 90.0 | 90.0 |
| oqmd-675622 | static | -1.3481 | -1.3481 | 15.4529 | 15.4336 | 15.707 | 90.0 | 96.1 | 90.0 |
| oqmd-5286 | box | -1.3481 | -1.3481 | 15.0354 | 18.449 | 34.8556 | 90.0 | 90.0 | 90.0 |
| oqmd-2065 | box | -1.348 | -1.348 | 11.7121 | 18.5277 | 13.2208 | 90.0 | 122.8 | 90.0 |
| oqmd-26737 | box | -1.348 | -1.348 | 15.4192 | 15.4156 | 15.6007 | 90.0 | 96.2 | 90.0 |
| oqmd-675622 | box | -1.348 | -1.348 | 15.4002 | 15.4288 | 15.6476 | 90.0 | 96.0 | 90.0 |
| oqmd-5012 | box | -1.3478 | -1.3478 | 6.7439 | 12.9229 | 20.79 | 90.0 | 90.0 | 90.0 |
| oqmd-24931 | box | -1.3469 | -1.3469 | 7.7766 | 14.0391 | 20.6838 | 95.6 | 99.4 | 100.9 |
| oqmd-3213 | box | -1.3468 | -1.3468 | 10.6949 | 16.0933 | 30.4077 | 90.0 | 90.0 | 90.0 |
| oqmd-6967 | box | -1.3463 | -1.3463 | 18.1628 | 14.8275 | 11.6153 | 90.0 | 109.0 | 90.0 |
| oqmd-11535 | box | -1.3433 | -1.3433 | 21.6524 | 12.0763 | 25.626 | 90.0 | 90.0 | 90.0 |
| oqmd-11536 | box | -1.3277 | -1.3277 | 18.9625 | 17.8449 | 25.2711 | 90.0 | 113.3 | 90.0 |
| oqmd-671132 | box | -1.288 | -1.288 | 21.8862 | 8.4148 | 29.9886 | 90.0 | 133.2 | 90.0 |
| oqmd-3448 | box | -1.2871 | -1.2871 | 21.8814 | 8.4196 | 29.9877 | 90.0 | 133.2 | 90.0 |
| oqmd-2392 | box | -0.9911 | -0.9911 | 14.1505 | 13.6266 | 11.1198 | 90.0 | 104.1 | 90.0 |
Download raw data (including filtered results)
Reference structure matches:
| prototype | method | Ecoh (eV/atom) | Epot (eV/atom) | a0 (Å) | b0 (Å) | c0 (Å) | α (degrees) | β (degrees) | γ (degrees) |
|---|
| C1--CaF2--fluorite | static | -2.0108 | -2.0108 | 6.7323 | 6.7323 | 6.7323 | 90.0 | 90.0 | 90.0 |
Download raw data (including filtered results)
Reference structure matches:
| prototype | method | Ecoh (eV/atom) | Epot (eV/atom) | a0 (Å) | b0 (Å) | c0 (Å) | α (degrees) | β (degrees) | γ (degrees) |
|---|
| L2_1--AlCu2Mn--heusler | static | -1.8391 | -1.8391 | 7.0332 | 7.0332 | 7.0332 | 90.0 | 90.0 | 90.0 |
Download raw data (including filtered results)
Reference structure matches:
| prototype | method | Ecoh (eV/atom) | Epot (eV/atom) | a0 (Å) | b0 (Å) | c0 (Å) | α (degrees) | β (degrees) | γ (degrees) |
|---|
| L2_1--AlCu2Mn--heusler | static | -2.1023 | -2.1023 | 6.7819 | 6.7819 | 6.7819 | 90.0 | 90.0 | 90.0 |
Download raw data (including filtered results)
Reference structure matches:
| prototype | method | Ecoh (eV/atom) | Epot (eV/atom) | a0 (Å) | b0 (Å) | c0 (Å) | α (degrees) | β (degrees) | γ (degrees) |
|---|
| C1--CaF2--fluorite | static | -1.9821 | -1.9821 | 6.8113 | 6.8113 | 6.8113 | 90.0 | 90.0 | 90.0 |
Download raw data (including filtered results)
Reference structure matches:
| prototype | method | Ecoh (eV/atom) | Epot (eV/atom) | a0 (Å) | b0 (Å) | c0 (Å) | α (degrees) | β (degrees) | γ (degrees) |
|---|
| L2_1--AlCu2Mn--heusler | static | -2.0874 | -2.0874 | 6.86 | 6.86 | 6.86 | 90.0 | 90.0 | 90.0 |
Download raw data (including filtered results)
Reference structure matches:
| prototype | method | Ecoh (eV/atom) | Epot (eV/atom) | a0 (Å) | b0 (Å) | c0 (Å) | α (degrees) | β (degrees) | γ (degrees) |
|---|
| C1--CaF2--fluorite | box | -2.6702 | -2.6702 | 6.4932 | 6.4932 | 6.4932 | 90.0 | 90.0 | 90.0 |
Download raw data (including filtered results)
Reference structure matches:
| prototype | method | Ecoh (eV/atom) | Epot (eV/atom) | a0 (Å) | b0 (Å) | c0 (Å) | α (degrees) | β (degrees) | γ (degrees) |
|---|
| D0_3--BiF3 | static | -2.2523 | -2.2523 | 7.1976 | 7.1976 | 7.1976 | 90.0 | 90.0 | 90.0 |
| L1_2--AuCu3 | static | -2.2207 | -2.2207 | 4.5813 | 4.5813 | 4.5813 | 90.0 | 90.0 | 90.0 |
| A15--Cr3Si | static | -1.8197 | -1.8197 | 5.7061 | 5.7061 | 5.7061 | 90.0 | 90.0 | 90.0 |
Download raw data (including filtered results)
Reference structure matches:
| prototype | method | Ecoh (eV/atom) | Epot (eV/atom) | a0 (Å) | b0 (Å) | c0 (Å) | α (degrees) | β (degrees) | γ (degrees) |
|---|
| D0_3--BiF3 | box | -2.2865 | -2.2865 | 7.235 | 7.235 | 7.235 | 90.0 | 90.0 | 90.0 |
| L1_2--AuCu3 | static | -2.2805 | -2.2805 | 4.6054 | 4.6054 | 4.6054 | 90.0 | 90.0 | 90.0 |
| A15--Cr3Si | static | -1.8697 | -1.8697 | 5.7441 | 5.7441 | 5.7441 | 90.0 | 90.0 | 90.0 |
Download raw data (including filtered results)
Reference structure matches:
| prototype | method | Ecoh (eV/atom) | Epot (eV/atom) | a0 (Å) | b0 (Å) | c0 (Å) | α (degrees) | β (degrees) | γ (degrees) |
|---|
| D0_3--BiF3 | static | -2.316 | -2.316 | 7.0616 | 7.0616 | 7.0616 | 90.0 | 90.0 | 90.0 |
| L1_2--AuCu3 | static | -2.1121 | -2.1121 | 4.5011 | 4.5011 | 4.5011 | 90.0 | 90.0 | 90.0 |
| A15--Cr3Si | static | -1.8207 | -1.8207 | 5.5739 | 5.5739 | 5.5739 | 90.0 | 90.0 | 90.0 |
Download raw data (including filtered results)
Reference structure matches:
B1--NaCl--rock-salt = mp-2559
| prototype | method | Ecoh (eV/atom) | Epot (eV/atom) | a0 (Å) | b0 (Å) | c0 (Å) | α (degrees) | β (degrees) | γ (degrees) |
|---|
| B3--ZnS--cubic-zinc-blende | dynamic | -2.1 | -2.1 | 5.8169 | 5.8169 | 5.8169 | 90.0 | 90.0 | 90.0 |
| L1_0--AuCu | box | -2.0056 | -2.0056 | 3.1963 | 3.1963 | 4.5841 | 90.0 | 90.0 | 90.0 |
| B2--CsCl | static | -1.9631 | -1.9631 | 3.5149 | 3.5149 | 3.5149 | 90.0 | 90.0 | 90.0 |
| B1--NaCl--rock-salt | static | -1.7616 | -1.7616 | 5.623 | 5.623 | 5.623 | 90.0 | 90.0 | 90.0 |
Download raw data (including filtered results)
Reference structure matches:
| prototype | method | Ecoh (eV/atom) | Epot (eV/atom) | a0 (Å) | b0 (Å) | c0 (Å) | α (degrees) | β (degrees) | γ (degrees) |
|---|
| C1--CaF2--fluorite | static | -1.9062 | -1.9062 | 6.8154 | 6.8154 | 6.8154 | 90.0 | 90.0 | 90.0 |
Download raw data (including filtered results)
Reference structure matches:
| prototype | method | Ecoh (eV/atom) | Epot (eV/atom) | a0 (Å) | b0 (Å) | c0 (Å) | α (degrees) | β (degrees) | γ (degrees) |
|---|
| L2_1--AlCu2Mn--heusler | static | -1.6764 | -1.6764 | 7.1388 | 7.1388 | 7.1388 | 90.0 | 90.0 | 90.0 |
Download raw data (including filtered results)
Reference structure matches:
| prototype | method | Ecoh (eV/atom) | Epot (eV/atom) | a0 (Å) | b0 (Å) | c0 (Å) | α (degrees) | β (degrees) | γ (degrees) |
|---|
| L2_1--AlCu2Mn--heusler | static | -1.9086 | -1.9086 | 6.9406 | 6.9406 | 6.9406 | 90.0 | 90.0 | 90.0 |
Download raw data (including filtered results)
Reference structure matches:
| prototype | method | Ecoh (eV/atom) | Epot (eV/atom) | a0 (Å) | b0 (Å) | c0 (Å) | α (degrees) | β (degrees) | γ (degrees) |
|---|
| D0_3--BiF3 | static | -1.8899 | -1.8899 | 7.3167 | 7.3167 | 7.3167 | 90.0 | 90.0 | 90.0 |
| L1_2--AuCu3 | static | -1.8683 | -1.8683 | 4.6438 | 4.6438 | 4.6438 | 90.0 | 90.0 | 90.0 |
| A15--Cr3Si | static | -1.5134 | -1.5134 | 5.788 | 5.788 | 5.788 | 90.0 | 90.0 | 90.0 |
Download raw data (including filtered results)
Reference structure matches:
| prototype | method | Ecoh (eV/atom) | Epot (eV/atom) | a0 (Å) | b0 (Å) | c0 (Å) | α (degrees) | β (degrees) | γ (degrees) |
|---|
| L2_1--AlCu2Mn--heusler | static | -1.629 | -1.629 | 7.3643 | 7.3643 | 7.3643 | 90.0 | 90.0 | 90.0 |
Download raw data (including filtered results)
Reference structure matches:
| prototype | method | Ecoh (eV/atom) | Epot (eV/atom) | a0 (Å) | b0 (Å) | c0 (Å) | α (degrees) | β (degrees) | γ (degrees) |
|---|
| L2_1--AlCu2Mn--heusler | static | -2.2699 | -2.2699 | 6.6094 | 6.6094 | 6.6094 | 90.0 | 90.0 | 90.0 |
Download raw data (including filtered results)
Reference structure matches:
| prototype | method | Ecoh (eV/atom) | Epot (eV/atom) | a0 (Å) | b0 (Å) | c0 (Å) | α (degrees) | β (degrees) | γ (degrees) |
|---|
| B3--ZnS--cubic-zinc-blende | dynamic | -2.0105 | -2.0105 | 6.0189 | 6.0189 | 6.0189 | 90.0 | 90.0 | 90.0 |
| L1_0--AuCu | box | -1.8517 | -1.8517 | 3.2937 | 3.2937 | 4.6157 | 90.0 | 90.0 | 90.0 |
| B2--CsCl | static | -1.8205 | -1.8205 | 3.629 | 3.629 | 3.629 | 90.0 | 90.0 | 90.0 |
| B1--NaCl--rock-salt | static | -1.8126 | -1.8126 | 5.7793 | 5.7793 | 5.7793 | 90.0 | 90.0 | 90.0 |
Download raw data (including filtered results)
Reference structure matches:
| prototype | method | Ecoh (eV/atom) | Epot (eV/atom) | a0 (Å) | b0 (Å) | c0 (Å) | α (degrees) | β (degrees) | γ (degrees) |
|---|
| C1--CaF2--fluorite | static | -1.8322 | -1.8322 | 7.1376 | 7.1376 | 7.1376 | 90.0 | 90.0 | 90.0 |
Download raw data (including filtered results)
Reference structure matches:
| prototype | method | Ecoh (eV/atom) | Epot (eV/atom) | a0 (Å) | b0 (Å) | c0 (Å) | α (degrees) | β (degrees) | γ (degrees) |
|---|
| L2_1--AlCu2Mn--heusler | static | -1.7582 | -1.7582 | 7.3198 | 7.3198 | 7.3198 | 90.0 | 90.0 | 90.0 |
Download raw data (including filtered results)
Reference structure matches:
| prototype | method | Ecoh (eV/atom) | Epot (eV/atom) | a0 (Å) | b0 (Å) | c0 (Å) | α (degrees) | β (degrees) | γ (degrees) |
|---|
| D0_3--BiF3 | static | -1.6855 | -1.6855 | 7.7376 | 7.7376 | 7.7376 | 90.0 | 90.0 | 90.0 |
| L1_2--AuCu3 | box | -1.5332 | -1.5332 | 4.9297 | 4.9297 | 4.9297 | 90.0 | 90.0 | 90.0 |
| A15--Cr3Si | static | -1.3383 | -1.3383 | 6.1074 | 6.1074 | 6.1074 | 90.0 | 90.0 | 90.0 |
Download raw data (including filtered results)
Reference structure matches:
| prototype | method | Ecoh (eV/atom) | Epot (eV/atom) | a0 (Å) | b0 (Å) | c0 (Å) | α (degrees) | β (degrees) | γ (degrees) |
|---|
| L2_1--AlCu2Mn--heusler | static | -1.9549 | -1.9549 | 6.8287 | 6.8287 | 6.8287 | 90.0 | 90.0 | 90.0 |
Download raw data (including filtered results)
Reference structure matches:
B3--ZnS--cubic-zinc-blende = mp-10695
| prototype | method | Ecoh (eV/atom) | Epot (eV/atom) | a0 (Å) | b0 (Å) | c0 (Å) | α (degrees) | β (degrees) | γ (degrees) |
|---|
| B3--ZnS--cubic-zinc-blende | dynamic | -3.08 | -3.08 | 5.406 | 5.406 | 5.406 | 90.0 | 90.0 | 90.0 |
| B1--NaCl--rock-salt | static | -2.8297 | -2.8297 | 5.2168 | 5.2168 | 5.2168 | 90.0 | 90.0 | 90.0 |
| B2--CsCl | static | -2.5607 | -2.5607 | 3.3159 | 3.3159 | 3.3159 | 90.0 | 90.0 | 90.0 |
Download raw data (including filtered results)
Reference structure matches:
| prototype | method | Ecoh (eV/atom) | Epot (eV/atom) | a0 (Å) | b0 (Å) | c0 (Å) | α (degrees) | β (degrees) | γ (degrees) |
|---|
| C1--CaF2--fluorite | dynamic | -2.4926 | -2.4926 | 6.0885 | 6.0885 | 6.0885 | 90.0 | 90.0 | 90.0 |
Download raw data (including filtered results)
Reference structure matches:
| prototype | method | Ecoh (eV/atom) | Epot (eV/atom) | a0 (Å) | b0 (Å) | c0 (Å) | α (degrees) | β (degrees) | γ (degrees) |
|---|
| D0_3--BiF3 | dynamic | -2.0975 | -2.0975 | 6.3353 | 6.3353 | 6.3353 | 90.0 | 90.0 | 90.0 |
| L1_2--AuCu3 | static | -2.0884 | -2.0884 | 4.0373 | 4.0373 | 4.0373 | 90.0 | 90.0 | 90.0 |
| A15--Cr3Si | static | -1.9712 | -1.9712 | 5.0624 | 5.0624 | 5.0624 | 90.0 | 90.0 | 90.0 |
Download raw data (including filtered results)
Reference structure matches:
A2--W--bcc = mp-119
A4--C--dc = mp-12771
Ah--alpha-Po--sc = mp-7755
| prototype | method | Ecoh (eV/atom) | Epot (eV/atom) | a0 (Å) | b0 (Å) | c0 (Å) | α (degrees) | β (degrees) | γ (degrees) |
|---|
| A3'--alpha-La--double-hcp | dynamic | -2.414 | -2.414 | 3.3828 | 3.3828 | 11.0482 | 90.0 | 90.0 | 120.0 |
| A1--Cu--fcc | dynamic | -2.414 | -2.414 | 4.784 | 4.784 | 4.784 | 90.0 | 90.0 | 90.0 |
| A3--Mg--hcp | dynamic | -2.414 | -2.414 | 3.3828 | 3.3828 | 5.5241 | 90.0 | 90.0 | 120.0 |
| A2--W--bcc | box | -2.3102 | -2.3102 | 3.7663 | 3.7663 | 3.7663 | 90.0 | 90.0 | 90.0 |
| A5--beta-Sn | static | -2.1045 | -2.1045 | 6.064 | 6.064 | 3.211 | 90.0 | 90.0 | 90.0 |
| Ah--alpha-Po--sc | dynamic | -2.0786 | -2.0786 | 3.1758 | 3.1758 | 3.1758 | 90.0 | 90.0 | 90.0 |
| A15--beta-W | static | -2.0559 | -2.0559 | 6.0026 | 6.0026 | 6.0026 | 90.0 | 90.0 | 90.0 |
| A4--C--dc | dynamic | -1.9296 | -1.9296 | 6.9725 | 6.9725 | 6.9725 | 90.0 | 90.0 | 90.0 |
Download raw data (including filtered results)
Reference structure matches:
| prototype | method | Ecoh (eV/atom) | Epot (eV/atom) | a0 (Å) | b0 (Å) | c0 (Å) | α (degrees) | β (degrees) | γ (degrees) |
|---|
| C1--CaF2--fluorite | static | -1.7265 | -1.7265 | 7.0123 | 7.0123 | 7.0123 | 90.0 | 90.0 | 90.0 |
Download raw data (including filtered results)
Reference structure matches:
| prototype | method | Ecoh (eV/atom) | Epot (eV/atom) | a0 (Å) | b0 (Å) | c0 (Å) | α (degrees) | β (degrees) | γ (degrees) |
|---|
| L2_1--AlCu2Mn--heusler | static | -1.7719 | -1.7719 | 7.0585 | 7.0585 | 7.0585 | 90.0 | 90.0 | 90.0 |
Download raw data (including filtered results)
Reference structure matches:
| prototype | method | Ecoh (eV/atom) | Epot (eV/atom) | a0 (Å) | b0 (Å) | c0 (Å) | α (degrees) | β (degrees) | γ (degrees) |
|---|
| C1--CaF2--fluorite | static | -2.1846 | -2.1846 | 6.7199 | 6.7199 | 6.7199 | 90.0 | 90.0 | 90.0 |
Download raw data (including filtered results)
Reference structure matches:
| prototype | method | Ecoh (eV/atom) | Epot (eV/atom) | a0 (Å) | b0 (Å) | c0 (Å) | α (degrees) | β (degrees) | γ (degrees) |
|---|
| L1_2--AuCu3 | static | -1.9507 | -1.9507 | 4.7121 | 4.7121 | 4.7121 | 90.0 | 90.0 | 90.0 |
| D0_3--BiF3 | static | -1.9146 | -1.9146 | 7.4177 | 7.4177 | 7.4177 | 90.0 | 90.0 | 90.0 |
| A15--Cr3Si | static | -1.5662 | -1.5662 | 5.8922 | 5.8922 | 5.8922 | 90.0 | 90.0 | 90.0 |
Download raw data (including filtered results)
Reference structure matches:
| prototype | method | Ecoh (eV/atom) | Epot (eV/atom) | a0 (Å) | b0 (Å) | c0 (Å) | α (degrees) | β (degrees) | γ (degrees) |
|---|
| D0_3--BiF3 | dynamic | -1.896 | -1.896 | 7.2404 | 7.2404 | 7.2404 | 90.0 | 90.0 | 90.0 |
| L1_2--AuCu3 | box | -1.778 | -1.778 | 4.5939 | 4.5939 | 4.5939 | 90.0 | 90.0 | 90.0 |
| A15--Cr3Si | static | -1.4752 | -1.4752 | 5.7117 | 5.7117 | 5.7117 | 90.0 | 90.0 | 90.0 |
Download raw data (including filtered results)
Reference structure matches:
| prototype | method | Ecoh (eV/atom) | Epot (eV/atom) | a0 (Å) | b0 (Å) | c0 (Å) | α (degrees) | β (degrees) | γ (degrees) |
|---|
| B3--ZnS--cubic-zinc-blende | dynamic | -1.83 | -1.83 | 6.26 | 6.26 | 6.26 | 90.0 | 90.0 | 90.0 |
| L1_0--AuCu | static | -1.723 | -1.723 | 3.3653 | 3.3653 | 4.7213 | 90.0 | 90.0 | 90.0 |
| B2--CsCl | static | -1.6952 | -1.6952 | 3.7081 | 3.7081 | 3.7081 | 90.0 | 90.0 | 90.0 |
| B1--NaCl--rock-salt | static | -1.5819 | -1.5819 | 5.9526 | 5.9526 | 5.9526 | 90.0 | 90.0 | 90.0 |
Download raw data (including filtered results)
Reference structure matches:
| prototype | method | Ecoh (eV/atom) | Epot (eV/atom) | a0 (Å) | b0 (Å) | c0 (Å) | α (degrees) | β (degrees) | γ (degrees) |
|---|
| C1--CaF2--fluorite | static | -1.7209 | -1.7209 | 7.2527 | 7.2527 | 7.2527 | 90.0 | 90.0 | 90.0 |
Download raw data (including filtered results)
Reference structure matches:
| prototype | method | Ecoh (eV/atom) | Epot (eV/atom) | a0 (Å) | b0 (Å) | c0 (Å) | α (degrees) | β (degrees) | γ (degrees) |
|---|
| L2_1--AlCu2Mn--heusler | static | -1.6908 | -1.6908 | 7.3876 | 7.3876 | 7.3876 | 90.0 | 90.0 | 90.0 |
Download raw data (including filtered results)
Reference structure matches:
| prototype | method | Ecoh (eV/atom) | Epot (eV/atom) | a0 (Å) | b0 (Å) | c0 (Å) | α (degrees) | β (degrees) | γ (degrees) |
|---|
| D0_3--BiF3 | dynamic | -1.7168 | -1.7168 | 7.7885 | 7.7885 | 7.7885 | 90.0 | 90.0 | 90.0 |
| L1_2--AuCu3 | static | -1.61 | -1.61 | 4.9455 | 4.9455 | 4.9455 | 90.0 | 90.0 | 90.0 |
| A15--Cr3Si | static | -1.3987 | -1.3987 | 6.1495 | 6.1495 | 6.1495 | 90.0 | 90.0 | 90.0 |
Download raw data (including filtered results)
Reference structure matches:
| prototype | method | Ecoh (eV/atom) | Epot (eV/atom) | a0 (Å) | b0 (Å) | c0 (Å) | α (degrees) | β (degrees) | γ (degrees) |
|---|
| L2_1--AlCu2Mn--heusler | static | -1.8643 | -1.8643 | 6.973 | 6.973 | 6.973 | 90.0 | 90.0 | 90.0 |
Download raw data (including filtered results)
Reference structure matches:
B3--ZnS--cubic-zinc-blende = mp-1190
| prototype | method | Ecoh (eV/atom) | Epot (eV/atom) | a0 (Å) | b0 (Å) | c0 (Å) | α (degrees) | β (degrees) | γ (degrees) |
|---|
| B3--ZnS--cubic-zinc-blende | dynamic | -2.694 | -2.694 | 5.669 | 5.669 | 5.669 | 90.0 | 90.0 | 90.0 |
| B1--NaCl--rock-salt | static | -2.2471 | -2.2471 | 5.4783 | 5.4783 | 5.4783 | 90.0 | 90.0 | 90.0 |
| B2--CsCl | static | -2.0853 | -2.0853 | 3.4387 | 3.4387 | 3.4387 | 90.0 | 90.0 | 90.0 |
Download raw data (including filtered results)
Reference structure matches:
| prototype | method | Ecoh (eV/atom) | Epot (eV/atom) | a0 (Å) | b0 (Å) | c0 (Å) | α (degrees) | β (degrees) | γ (degrees) |
|---|
| C1--CaF2--fluorite | dynamic | -2.0003 | -2.0003 | 6.3456 | 6.3456 | 6.3456 | 90.0 | 90.0 | 90.0 |
Download raw data (including filtered results)
Reference structure matches:
L1_2--AuCu3 = mp-1187912
| prototype | method | Ecoh (eV/atom) | Epot (eV/atom) | a0 (Å) | b0 (Å) | c0 (Å) | α (degrees) | β (degrees) | γ (degrees) |
|---|
| D0_3--BiF3 | dynamic | -1.7891 | -1.7891 | 6.5269 | 6.5269 | 6.5269 | 90.0 | 90.0 | 90.0 |
| L1_2--AuCu3 | static | -1.7284 | -1.7284 | 4.16 | 4.16 | 4.16 | 90.0 | 90.0 | 90.0 |
| A15--Cr3Si | static | -1.6335 | -1.6335 | 5.2481 | 5.2481 | 5.2481 | 90.0 | 90.0 | 90.0 |
Download raw data (including filtered results)
Reference structure matches:
A1--Cu--fcc = oqmd-1214577
A15--beta-W = oqmd-1215022, oqmd-1280348
A2--W--bcc = oqmd-1215200
A3'--alpha-La--double-hcp = oqmd-1215468
A3--Mg--hcp = oqmd-1215378
A4--C--dc = oqmd-1215557
A5--beta-Sn = oqmd-1215646
A6--In--bct = oqmd-1215735
| prototype | method | Ecoh (eV/atom) | Epot (eV/atom) | a0 (Å) | b0 (Å) | c0 (Å) | α (degrees) | β (degrees) | γ (degrees) |
|---|
| A1--Cu--fcc | dynamic | -2.169 | -2.169 | 5.142 | 5.142 | 5.142 | 90.0 | 90.0 | 90.0 |
| A3'--alpha-La--double-hcp | static | -2.169 | -2.169 | 3.6359 | 3.6359 | 11.8749 | 90.0 | 90.0 | 120.0 |
| A3--Mg--hcp | dynamic | -2.169 | -2.169 | 3.6359 | 3.6359 | 5.9375 | 90.0 | 90.0 | 120.0 |
| A2--W--bcc | dynamic | -2.1311 | -2.1311 | 4.0399 | 4.0399 | 4.0399 | 90.0 | 90.0 | 90.0 |
| oqmd-1214844 | dynamic | -2.0571 | -2.0571 | 12.585 | 12.585 | 12.585 | 90.0 | 90.0 | 90.0 |
| oqmd-1215289 | dynamic | -2.0398 | -2.0398 | 3.534 | 9.1127 | 4.5563 | 90.0 | 90.0 | 90.0 |
| A3--Mg--hcp | dynamic | -2.0346 | -2.0346 | 4.9076 | 4.9076 | 3.8167 | 90.0 | 90.0 | 120.0 |
| A5--beta-Sn | static | -2.0193 | -2.0193 | 6.4288 | 6.4288 | 3.4354 | 90.0 | 90.0 | 90.0 |
| A3'--alpha-La--double-hcp | dynamic | -2.0058 | -2.0058 | 4.826 | 4.826 | 7.7365 | 90.0 | 90.0 | 120.0 |
| Ah--alpha-Po--sc | dynamic | -1.9829 | -1.9829 | 3.377 | 3.377 | 3.377 | 90.0 | 90.0 | 90.0 |
| A4--C--dc | dynamic | -1.9452 | -1.9452 | 7.3142 | 7.3142 | 7.3142 | 90.0 | 90.0 | 90.0 |
| A15--beta-W | static | -1.9233 | -1.9233 | 6.4403 | 6.4403 | 6.4403 | 90.0 | 90.0 | 90.0 |
| oqmd-76384 | box | -1.8469 | -1.8469 | 4.6729 | 4.4974 | 7.7286 | 90.0 | 90.8 | 90.0 |
| A7--alpha-As | box | -1.8447 | -1.8447 | 5.0743 | 5.0743 | 10.2568 | 90.0 | 90.0 | 120.0 |
| oqmd-9307 | box | -1.8447 | -1.8447 | 3.3902 | 8.3261 | 5.3566 | 90.0 | 107.9 | 90.0 |
| oqmd-1214755 | box | -1.7941 | -1.7941 | 4.9526 | 8.6673 | 7.6305 | 90.0 | 90.0 | 90.0 |
| oqmd-1216002 | box | -1.6891 | -1.6891 | 5.5525 | 5.5525 | 6.7631 | 90.0 | 90.0 | 120.0 |
| oqmd-1215289 | static | -1.5909 | -1.5909 | 3.347 | 13.0101 | 5.2524 | 90.0 | 90.0 | 90.0 |
| oqmd-1214933 | box | -1.3797 | -1.3797 | 10.2803 | 10.2803 | 10.2803 | 90.0 | 90.0 | 90.0 |
Download raw data (including filtered results)
Reference structure matches:
| prototype | method | Ecoh (eV/atom) | Epot (eV/atom) | a0 (Å) | b0 (Å) | c0 (Å) | α (degrees) | β (degrees) | γ (degrees) |
|---|
| C1--CaF2--fluorite | static | -1.9293 | -1.9293 | 7.187 | 7.187 | 7.187 | 90.0 | 90.0 | 90.0 |
Download raw data (including filtered results)
Reference structure matches:
| prototype | method | Ecoh (eV/atom) | Epot (eV/atom) | a0 (Å) | b0 (Å) | c0 (Å) | α (degrees) | β (degrees) | γ (degrees) |
|---|
| D0_3--BiF3 | static | -1.7291 | -1.7291 | 7.7327 | 7.7327 | 7.7327 | 90.0 | 90.0 | 90.0 |
| L1_2--AuCu3 | box | -1.5556 | -1.5556 | 4.9143 | 4.9143 | 4.9143 | 90.0 | 90.0 | 90.0 |
| A15--Cr3Si | static | -1.3809 | -1.3809 | 6.0982 | 6.0982 | 6.0982 | 90.0 | 90.0 | 90.0 |
Download raw data (including filtered results)
Reference structure matches:
B1--NaCl--rock-salt = mp-948
B3--ZnS--cubic-zinc-blende = mp-2176
| prototype | method | Ecoh (eV/atom) | Epot (eV/atom) | a0 (Å) | b0 (Å) | c0 (Å) | α (degrees) | β (degrees) | γ (degrees) |
|---|
| B3--ZnS--cubic-zinc-blende | dynamic | -2.364 | -2.364 | 6.101 | 6.101 | 6.101 | 90.0 | 90.0 | 90.0 |
| B1--NaCl--rock-salt | static | -1.973 | -1.973 | 5.8712 | 5.8712 | 5.8712 | 90.0 | 90.0 | 90.0 |
| B2--CsCl | static | -1.8153 | -1.8153 | 3.6727 | 3.6727 | 3.6727 | 90.0 | 90.0 | 90.0 |
Download raw data (including filtered results)
Reference structure matches:
| prototype | method | Ecoh (eV/atom) | Epot (eV/atom) | a0 (Å) | b0 (Å) | c0 (Å) | α (degrees) | β (degrees) | γ (degrees) |
|---|
| C1--CaF2--fluorite | dynamic | -1.7248 | -1.7248 | 6.805 | 6.805 | 6.805 | 90.0 | 90.0 | 90.0 |
Download raw data (including filtered results)
Reference structure matches:
| prototype | method | Ecoh (eV/atom) | Epot (eV/atom) | a0 (Å) | b0 (Å) | c0 (Å) | α (degrees) | β (degrees) | γ (degrees) |
|---|
| D0_3--BiF3 | dynamic | -1.5603 | -1.5603 | 6.8436 | 6.8436 | 6.8436 | 90.0 | 90.0 | 90.0 |
| A15--Cr3Si | static | -1.4732 | -1.4732 | 5.5593 | 5.5593 | 5.5593 | 90.0 | 90.0 | 90.0 |
| L1_2--AuCu3 | static | -1.3998 | -1.3998 | 4.3704 | 4.3704 | 4.3704 | 90.0 | 90.0 | 90.0 |
Download raw data (including filtered results)
Reference structure matches:
A3--Mg--hcp = mp-79
| prototype | method | Ecoh (eV/atom) | Epot (eV/atom) | a0 (Å) | b0 (Å) | c0 (Å) | α (degrees) | β (degrees) | γ (degrees) |
|---|
| A1--Cu--fcc | dynamic | -1.325 | -1.325 | 4.009 | 4.009 | 4.009 | 90.0 | 90.0 | 90.0 |
| A3--Mg--hcp | dynamic | -1.325 | -1.325 | 2.8348 | 2.8348 | 4.6292 | 90.0 | 90.0 | 120.0 |
| A3'--alpha-La--double-hcp | box | -1.325 | -1.325 | 2.8348 | 2.8348 | 9.2584 | 90.0 | 90.0 | 120.0 |
| A2--W--bcc | static | -1.2559 | -1.2559 | 3.1586 | 3.1586 | 3.1586 | 90.0 | 90.0 | 90.0 |
| A5--beta-Sn | box | -1.1294 | -1.1294 | 5.1046 | 5.1046 | 2.6964 | 90.0 | 90.0 | 90.0 |
| Ah--alpha-Po--sc | dynamic | -1.1177 | -1.1177 | 2.6702 | 2.6702 | 2.6702 | 90.0 | 90.0 | 90.0 |
| A15--beta-W | box | -1.1116 | -1.1116 | 5.0336 | 5.0336 | 5.0336 | 90.0 | 90.0 | 90.0 |
| A4--C--dc | dynamic | -1.019 | -1.019 | 5.886 | 5.886 | 5.886 | 90.0 | 90.0 | 90.0 |