-
Citation: M.I. Mendelev, and G.J. Ackland (2007), "Development of an interatomic potential for the simulation of phase transformations in zirconium", Philosophical Magazine Letters 87(5), 349-359. DOI: 10.1080/09500830701191393.Abstract: In recent years, some 30 studies have been published on the molecular dynamics (MD) of zirconium, primarily of its twinning deformation and response to radiation damage. Its low thermal neutron absorption makes it uniquely suited for the latter application. Surprisingly, currently used interatomic potentials do not encapsulate the unique properties of Zr, namely its high stacking-fault energy, anomolous self-diffusion, melting and phase transformation under temperature and pressure (or alloying). Ab initio calculations have shown deficiencies in the description of point defects, both vacancies and interstitials, using existing interatomic potentials, deficiencies that can now be rectified by refitting. Here, we show the calculation of phase transitions self-consistently and present a potential for Zr that correctly reproduces the energetics of our extended database of ab initio configurations and high-temperature phase transitions. The potential has an analytic many-body form, making it suitable for existing large-scale MD codes. We also present a best-fit potential for the hcp structure and its defects.
Notes: This listing is for the reference's potential parameter set #3.
Related Models: -
LAMMPS pair_style eam/alloy (2007--Mendelev-M-I--Zr-3--LAMMPS--ipr1)See Computed Properties
Notes: This file was provided by Mikhail Mendelev. Except for comments, this file is identical to "Zr_mm.eam.fs" in the August 22, 2018 LAMMPS distribution. Update 19 July 2021: The contact email in the file's header has been changed.
File(s): superseded -
LAMMPS pair_style eam/alloy (2007--Mendelev-M-I--Zr-3--LAMMPS--ipr2)See Computed Properties
Notes: Update 09 Mar 2009: New files for Zr #2 and Zr #3 (24 Feb 2009) were sent as replacements for the previous version. They better treat radial distances smaller than 0.5 A for use in radiation damage simulations. Update 19 July 2021: The contact email in the file's header has been changed.
File(s):Zr #3: Zr_3.eam.fs -
OpenKIM (MO_537826574817)See Computed Properties
Notes: Listing found at https://openkim.org. This KIM potential is based on the files from 2007--Mendelev-M-I--Zr-3--LAMMPS--ipr1.
Link(s): superseded -
OpenKIM (MO_004835508849)See Computed Properties
Notes: Listing found at https://openkim.org. This KIM potential is based on the files from 2007--Mendelev-M-I--Zr-3--LAMMPS--ipr2.
Link(s):
Implementation Information
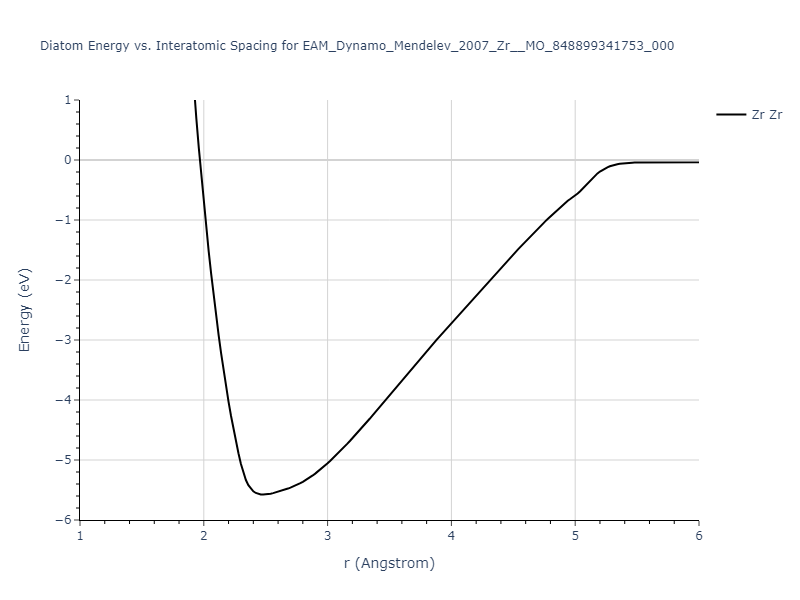
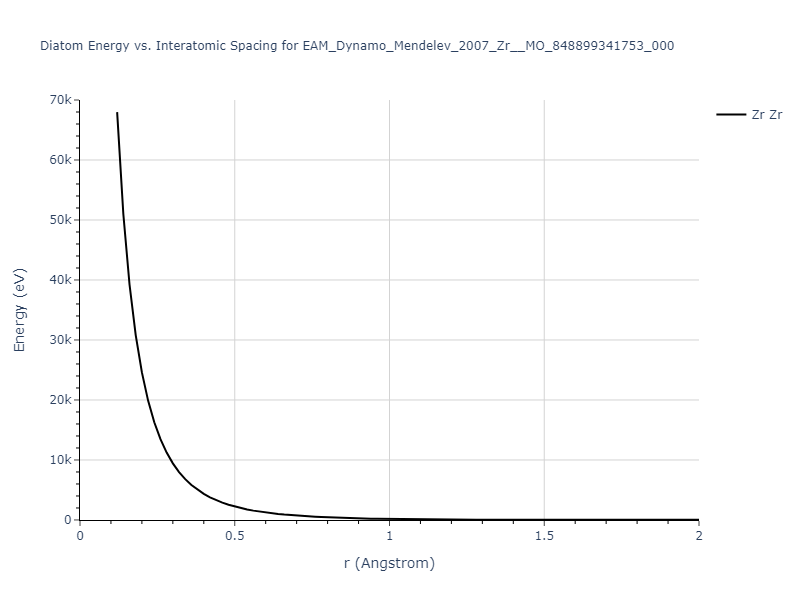
Diatom Energy vs. Interatomic Spacing
Plots of the potential energy vs interatomic spacing, r, are shown below for all diatom sets associated with the interatomic potential. This calculation provides insights into the functional form of the potential's two-body interactions. A system consisting of only two atoms is created, and the potential energy is evaluated for the atoms separated by 0.02 Å <= r <= 6.0> Å in intervals of 0.02 Å. Two plots are shown: one for the "standard" interaction distance range, and one for small values of r. The small r plot is useful for determining whether the potential is suitable for radiation studies.
The calculation method used is available as the iprPy diatom_scan calculation method.
Clicking on the image of a plot will open an interactive version of it in a new tab. The underlying data for the plots can be downloaded by clicking on the links above each plot.
Notes and Disclaimers:
- These values are meant to be guidelines for comparing potentials, not the absolute values for any potential's properties. Values listed here may change if the calculation methods are updated due to improvements/corrections. Variations in the values may occur for variations in calculation methods, simulation software and implementations of the interatomic potentials.
- As this calculation only involves two atoms, it neglects any multi-body interactions that may be important in molecules, liquids and crystals.
- NIST disclaimer
Version Information:
- 2019-11-14. Maximum value range on the shortrange plots are now limited to "expected" levels as details are otherwise lost.
- 2019-08-07. Plots added.
Click on plot to load interactive version
Click on plot to load interactive version
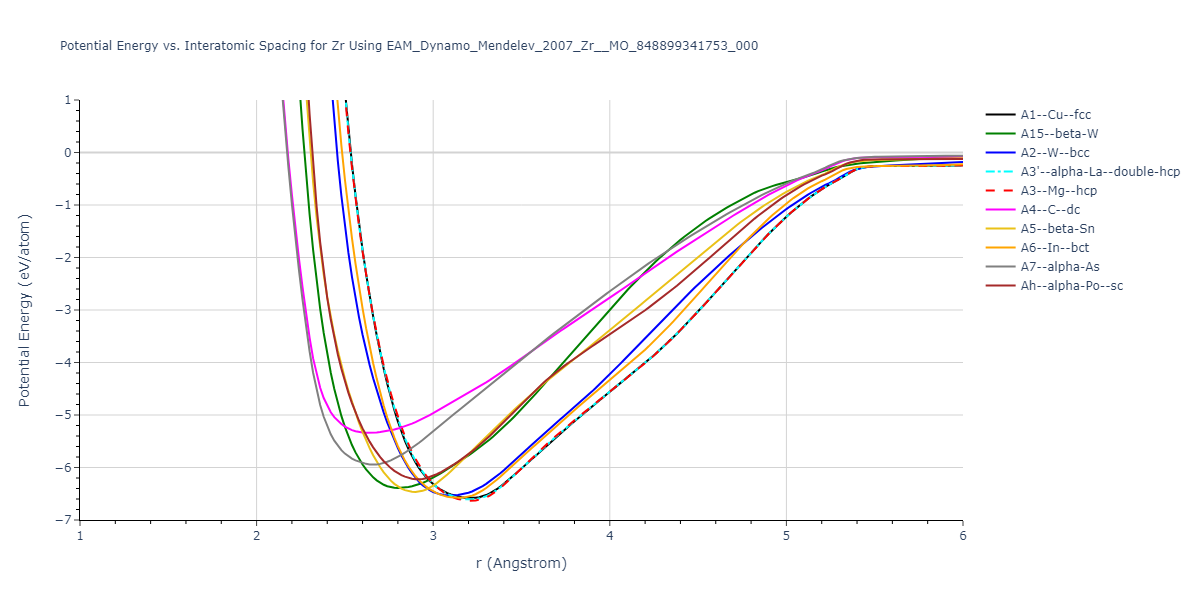
Cohesive Energy vs. Interatomic Spacing
Plots of potential energy vs interatomic spacing, r, are shown below for a number of crystal structures. The structures are generated based on the ideal atomic positions and b/a and c/a lattice parameter ratios for a given crystal prototype. The size of the system is then uniformly scaled, and the energy calculated without relaxing the system. To obtain these plots, values of r are evaluated every 0.02 Å up to 6 Å.
The calculation method used is available as the iprPy E_vs_r_scan calculation method.
Clicking on the image of a plot will open an interactive version of it in a new tab. The underlying data for the plots can be downloaded by clicking on the links above each plot.
Notes and Disclaimers:
- These values are meant to be guidelines for comparing potentials, not the absolute values for any potential's properties. Values listed here may change if the calculation methods are updated due to improvements/corrections. Variations in the values may occur for variations in calculation methods, simulation software and implementations of the interatomic potentials.
- The minima identified by this calculation do not guarantee that the associated crystal structures will be stable since no relaxation is performed.
- NIST disclaimer
Version Information:
- 2020-12-18. Descriptions, tables and plots updated to reflect that the energy values are the measuredper atom potential energy rather than cohesive energy as some potentials have non-zero isolated atom energies.
- 2019-02-04. Values regenerated with even r spacings of 0.02 Å, and now include values less than 2 Å when possible. Updated calculation method and parameters enhance compatibility with more potential styles.
- 2019-04-26. Results for hcp, double hcp, α-As and L10 prototypes regenerated from different unit cell representations. Only α-As results show noticable (>1e-5 eV) difference due to using a different coordinate for Wykoff site c position.
- 2018-06-13. Values for MEAM potentials corrected. Dynamic versions of the plots moved to separate pages to improve page loading. Cosmetic changes to how data is shown and updates to the documentation.
- 2017-01-11. Replaced png pictures with interactive Bokeh plots. Data regenerated with 200 values of r instead of 300.
- 2016-09-28. Plots for binary structures added. Data and plots for elemental structures regenerated. Data values match the values of the previous version. Data table formatting slightly changed to increase precision and ensure spaces between large values. Composition added to plot title and structure names made longer.
- 2016-04-07. Plots for elemental structures added.
Crystal Structure Predictions
Computed lattice constants and cohesive/potential energies are displayed for a variety of crystal structures. The values displayed here are obtained using the following process.
- Initial crystal structure guesses are taken from:
- The iprPy E_vs_r_scan calculation results (shown above) by identifying all energy minima along the measured curves for a given crystal prototype + composition.
- Structures in the Materials Project and OQMD DFT databases.
- All initial guesses are relaxed using three independent methods using a 10x10x10 supercell:
- "box": The system's lattice constants are adjusted to zero pressure without internal relaxations using the iprPy relax_box calculation with a strainrange of 1e-6.
- "static": The system's lattice and atomic positions are statically relaxed using the iprPy relax_static calculation with a minimization force tolerance of 1e-10 eV/Angstrom.
- "dynamic": The system's lattice and atomic positions are dynamically relaxed for 10000 timesteps of 0.01 ps using the iprPy relax_dynamic calculation with an nph integration plus Langevin thermostat. The final configuration is then used as input in running an iprPy relax_static calculation with a minimization force tolerance of 1e-10 eV/Angstrom.
- The relaxed structures obtained from #2 are then evaluated using the spglib package to identify an ideal crystal unit cell based on the results.
- The space group information of the ideal unit cells is compared to the space group information of the corresponding reference structures to identify which structures transformed upon relaxation. The structures that did not transform to a different structure are listed in the table(s) below. The "method" field indicates the most rigorous relaxation method where the structure did not transform. The space group information is also used to match the DFT reference structures to the used prototype, where possible.
- The cohesive energy, Ecoh, is calculated from the measured potential energy per atom, Epot$, by subtracting the isolated energy averaged across all atoms in the unit cell. The isolated atom energies of each species model is obtained either by evaluating a single atom atomic configuration, or by identifying the first energy plateau from the diatom scan calculations for r > 2 Å.
The calculation methods used are implemented into iprPy as the following calculation styles
Notes and Disclaimers:
- These values are meant to be guidelines for comparing potentials, not the absolute values for any potential's properties. Values listed here may change if the calculation methods are updated due to improvements/corrections. Variations in the values may occur for variations in calculation methods, simulation software and implementations of the interatomic potentials.
- The presence of any structures in this list does not guarantee that those structures are stable. Also, the lowest energy structure may not be included in this list.
- Multiple values for the same crystal structure but different lattice constants are possible. This is because multiple energy minima are possible for a given structure and interatomic potential. Having multiple energy minima for a structure does not necessarily make the potential "bad" as unwanted configurations may be unstable or correspond to conditions that may not be relevant to the problem of interest (eg. very high strains).
- NIST disclaimer
Version Information:
- 2025-07-02. All "mp-" reference structure calculations were re-relaxed using the updated Materials Project database rather than the original database structures. Also, a bug was fixed that caused the "static" relaxations to occasionally throw unnecessary errors. This was fixed and all affected calculations were reset and performed again.
- 2022-05-27. The "box" method results have all been redone with an updated methodology more suited for non-orthogonal systems.
- 2020-12-18. Cohesive energies have been corrected by making them relative to the energies of the isolated atoms. The previous cohesive energy values are now listed as the potential energies.
- 2019-06-07. Structures with positive or near zero cohesive energies removed from the display tables. All values still present in the raw data files.
- 2019-04-26. Calculations now computed for each implementation. Results for hcp, double hcp, α-As and L10 prototypes regenerated from different unit cell representations.
- 2018-06-14. Methodology completely changed affecting how the information is displayed. Calculations involving MEAM potentials corrected.
- 2016-09-28. Values for simple compounds added. All identified energy minima for each structure are listed. The existing elemental data was regenerated. Most values are consistent with before, but some differences have been noted. Specifically, variations are seen with some values for potentials where the elastic constants don't vary smoothly near the equilibrium state. Additionally, the inclusion of some high-energy structures has changed based on new criteria for identifying when structures have relaxed to another structure.
- 2016-04-07. Values for elemental crystal structures added. Only values for the global energy minimum of each unique structure given.
Download raw data (including filtered results)
Reference structure matches:
A1--Cu--fcc = mp-8635, oqmd-7509
A15--beta-W = oqmd-1215034
A2--W--bcc = mp-41, oqmd-9320
A3'--alpha-La--double-hcp = oqmd-1215480
A3--Mg--hcp = mp-131, oqmd-67408, oqmd-758445, oqmd-758446, oqmd-758447, oqmd-758451, oqmd-758458, oqmd-758460, oqmd-758469
A4--C--dc = oqmd-1215569
A5--beta-Sn = oqmd-1215658
A6--In--bct = oqmd-1215747
| prototype | method | Ecoh (eV/atom) | Epot (eV/atom) | a0 (Å) | b0 (Å) | c0 (Å) | α (degrees) | β (degrees) | γ (degrees) |
|---|---|---|---|---|---|---|---|---|---|
| A3--Mg--hcp | dynamic | -6.6347 | -6.6347 | 3.2341 | 3.2341 | 5.1677 | 90.0 | 90.0 | 120.0 |
| A3--Mg--hcp | box | -6.6347 | -6.6347 | 3.2339 | 3.2339 | 5.1677 | 90.0 | 90.0 | 120.0 |
| oqmd-758444 | box | -6.6347 | -6.6347 | 3.2357 | 5.5985 | 5.1677 | 90.0 | 90.0 | 90.0 |
| oqmd-1215301 | box | -6.6336 | -6.6336 | 3.2469 | 5.5752 | 5.1689 | 90.0 | 90.0 | 90.0 |
| A3'--alpha-La--double-hcp | dynamic | -6.6071 | -6.6071 | 3.2208 | 3.2208 | 10.4062 | 90.0 | 90.0 | 120.0 |
| A1--Cu--fcc | dynamic | -6.5804 | -6.5804 | 4.5378 | 4.5378 | 4.5378 | 90.0 | 90.0 | 90.0 |
| mp-1056376 | dynamic | -6.5496 | -6.5496 | 3.0761 | 3.0761 | 2.9255 | 90.0 | 90.0 | 120.0 |
| A2--W--bcc | static | -6.5317 | -6.5317 | 3.5759 | 3.5759 | 3.5759 | 90.0 | 90.0 | 90.0 |
| oqmd-1214945 | dynamic | -6.5193 | -6.5193 | 7.7368 | 7.7368 | 7.7368 | 90.0 | 90.0 | 90.0 |
| oqmd-1215123 | box | -6.5144 | -6.5144 | 5.278 | 11.2274 | 3.1884 | 90.0 | 90.0 | 90.0 |
| oqmd-1214856 | dynamic | -6.4897 | -6.4897 | 10.9282 | 10.9282 | 10.9282 | 90.0 | 90.0 | 90.0 |
| oqmd-1214945 | box | -6.4797 | -6.4797 | 7.7499 | 7.7499 | 7.7499 | 90.0 | 90.0 | 90.0 |
| A5--beta-Sn | static | -6.4755 | -6.4755 | 5.6475 | 5.6475 | 3.0001 | 90.0 | 90.0 | 90.0 |
| oqmd-1214856 | box | -6.4549 | -6.4549 | 10.8981 | 10.8981 | 10.8981 | 90.0 | 90.0 | 90.0 |
| A15--beta-W | static | -6.3915 | -6.3915 | 5.6068 | 5.6068 | 5.6068 | 90.0 | 90.0 | 90.0 |
| Ah--alpha-Po--sc | static | -6.224 | -6.224 | 2.9141 | 2.9141 | 2.9141 | 90.0 | 90.0 | 90.0 |
| oqmd-1216014 | static | -5.754 | -5.754 | 4.9028 | 4.9028 | 5.5973 | 90.0 | 90.0 | 120.0 |
| A4--C--dc | static | -5.3371 | -5.3371 | 6.0903 | 6.0903 | 6.0903 | 90.0 | 90.0 | 90.0 |
| mp-1178608 | dynamic | -5.0075 | -5.0075 | 3.0045 | 3.0045 | 7.6005 | 90.0 | 90.0 | 120.0 |
| A3--Mg--hcp | dynamic | -0.2598 | -0.2598 | 5.7252 | 5.7252 | 9.3491 | 90.0 | 90.0 | 120.0 |
| A1--Cu--fcc | dynamic | -0.2598 | -0.2598 | 8.0966 | 8.0966 | 8.0966 | 90.0 | 90.0 | 90.0 |
| Ah--alpha-Po--sc | dynamic | -0.1299 | -0.1299 | 5.7252 | 5.7252 | 5.7252 | 90.0 | 90.0 | 90.0 |
| A4--C--dc | dynamic | -0.0866 | -0.0866 | 13.2217 | 13.2217 | 13.2217 | 90.0 | 90.0 | 90.0 |