OOF: Finite Element Analysis of Microstructures
Next: Element Info Dashboard Up: The Dashboards Previous: Attributes Dashboard Contents
Color Dashboard
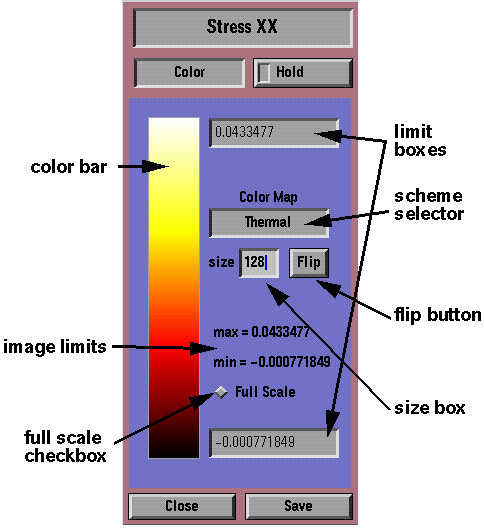
The Color Dashboard (Figure 5.3) controls the color scheme used to display stresses and strains in the various Stress and Strain Drawers. Because the form of the Color Dashboard is identical, no matter what's being displayed, in this section we'll call the displayed quantity stress to avoid excess, extraneous, and superfluous verbiage.
The bar on the left side is the color bar; it displays all of the colors used in the image.
The maximum and minimum values of stress in the grid are printed in
the region labeled image limits in Figure 5.3.
These values correspond to the range of colors displayed in the Drawer
if the Full Scale check box is highlighted. If Full Scale
is not highlighted, then the limit boxes at the ends of the color bar indicate the values of stress corresponding to the colors at
the ends of the bar. These limits can be changed by typing new values
into the limit boxes. (Make sure to hit ![]() return
return![]() after typing a
new value, or it won't take effect.) The limit boxes do not
appear if Full Scale is on.
after typing a
new value, or it won't take effect.) The limit boxes do not
appear if Full Scale is on.
The color scheme determines how values of stress are converted into colors. The name of the current color scheme is shown in the Scheme Selector. Use the left mouse button on the Scheme Selector to bring up a menu of available color schemes, or use the middle and right buttons to cycle through the schemes. The number of colors used in the scheme can be set by typing in the Size box. A large number of colors (say 100) will give smooth gradations, but smaller numbers (10 or 20) can be useful for visualizing stress contours. On machines with 8-bit graphics, attempting to use too many colors is a mistake. The Flip button inverts the color scheme.
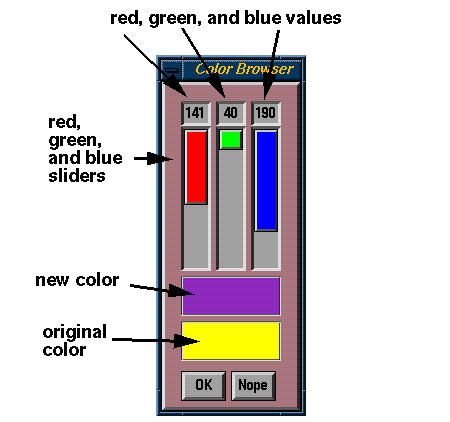
The Color Dashboard includes a primitive way of editing the colors in the current color scheme. This can be handy if you'd like to highlight a particular value of stress in the image. Clicking on a color in the color bar with the right mouse button will print the color and the stress range that it represents in the Message Window. Clicking with the left mouse button brings up a Color Browser (Figure 5.4) which allows the color to be changed. Clicking on the color bar with the middle mouse button makes the chosen color revert to its default value in the current color scheme. Note that the changes in the color scheme are lost if you change Drawers!
 |
Next: Element Info Dashboard Up: The Dashboards Previous: Attributes Dashboard Contents /* Send mail to the OOF Team *//* Go to the OOF Home Page */
