-
Citation: Y. Li, and Y. Mishin (2026), "The effect of normal stress on stacking fault energy in face-centered cubic metals". DOI: 10.48550/ARXIV.2601.05453.Abstract: Plastic deformation and fracture of FCC metals involve the formation of stable or unstable stacking faults (SFs) on (111) plane. Examples include dislocation cross-slip and dislocation nucleation at interfaces and near crack tips. The stress component normal to (111) plane can strongly affect the SF energy when the stress magnitude reaches several to tens of GPa. We conduct a series of DFT calculations of SF energies in six FCC metals: Al, Ni, Cu, Ag, Au, and Pt. The results show that normal compression significantly increases the stable and unstable SF energies in all six metals, while normal tension decreases them. The SF formation is accompanied by inelastic expansion in the normal direction. The DFT calculations are compared with predictions of several representative classical and machine-learning interatomic potentials. Many potentials fail to capture the correct stress effect on the SF energy, often predicting trends opposite to the DFT calculations. Possible ways to improve the ability of potentials to represent the stress effect on SF energy are discussed.
Notes: This entry is for the Moment Tensor Potential (MTP) aluminum potential introduced in the reference.
-
LAMMPS pair_style hybrid/overlay zbl mlip (custom) (2026--Li-Y--Al-MTP--LAMMPS--ipr1)See Computed Properties
Notes: These files were provided by Yang Li and Yuri Mishin on Feb 16, 2026. This potential is to be used together with ZBL in LAMMPS (see the pot.in file for an example LAMMPS input pair_style and pair_coeff lines).
File(s): Link(s):LAMMPS-MLIP interface https://gitlab.com/ashapeev/interface-lammps-mlip-2
Implementation Information
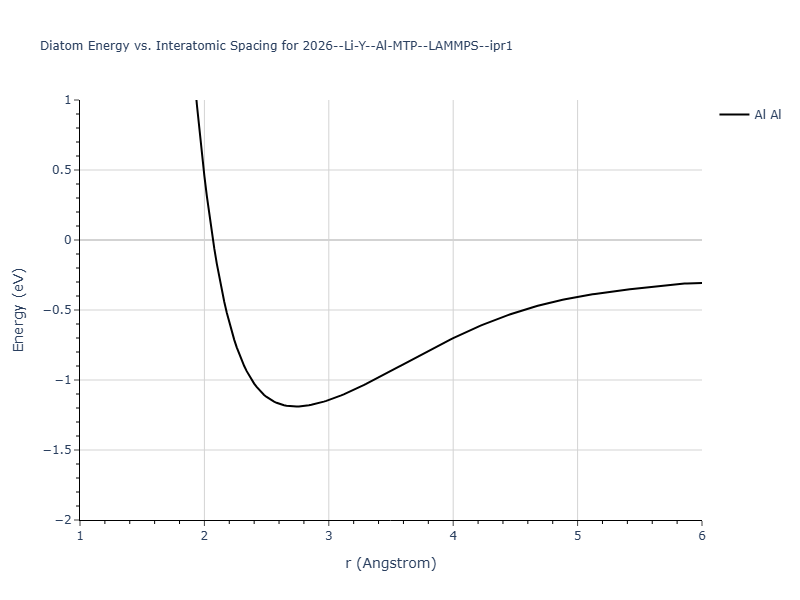
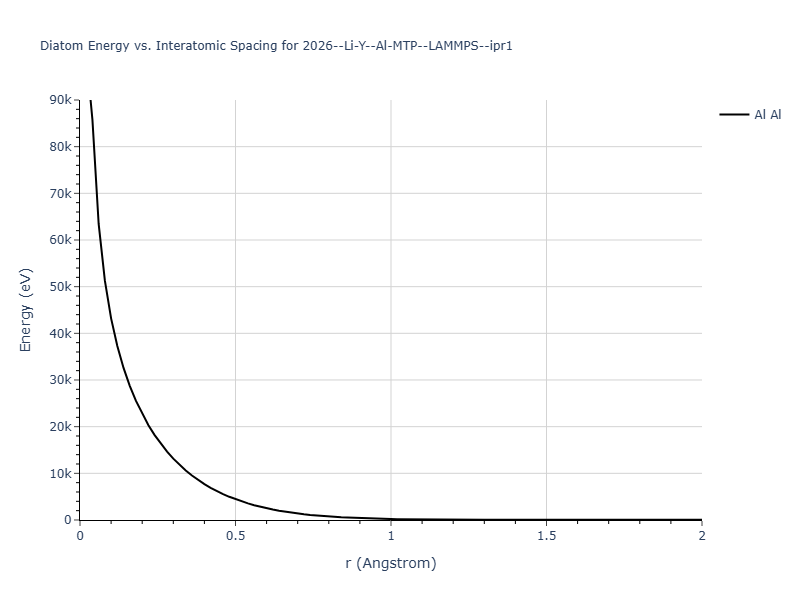
Diatom Energy vs. Interatomic Spacing
Plots of the potential energy vs interatomic spacing, r, are shown below for all diatom sets associated with the interatomic potential. This calculation provides insights into the functional form of the potential's two-body interactions. A system consisting of only two atoms is created, and the potential energy is evaluated for the atoms separated by 0.02 Å <= r <= 6.0> Å in intervals of 0.02 Å. Two plots are shown: one for the "standard" interaction distance range, and one for small values of r. The small r plot is useful for determining whether the potential is suitable for radiation studies.
The calculation method used is available as the iprPy diatom_scan calculation method.
Clicking on the image of a plot will open an interactive version of it in a new tab. The underlying data for the plots can be downloaded by clicking on the links above each plot.
Notes and Disclaimers:
- These values are meant to be guidelines for comparing potentials, not the absolute values for any potential's properties. Values listed here may change if the calculation methods are updated due to improvements/corrections. Variations in the values may occur for variations in calculation methods, simulation software and implementations of the interatomic potentials.
- As this calculation only involves two atoms, it neglects any multi-body interactions that may be important in molecules, liquids and crystals.
- NIST disclaimer
Version Information:
- 2019-11-14. Maximum value range on the shortrange plots are now limited to "expected" levels as details are otherwise lost.
- 2019-08-07. Plots added.
Click on plot to load interactive version
Click on plot to load interactive version
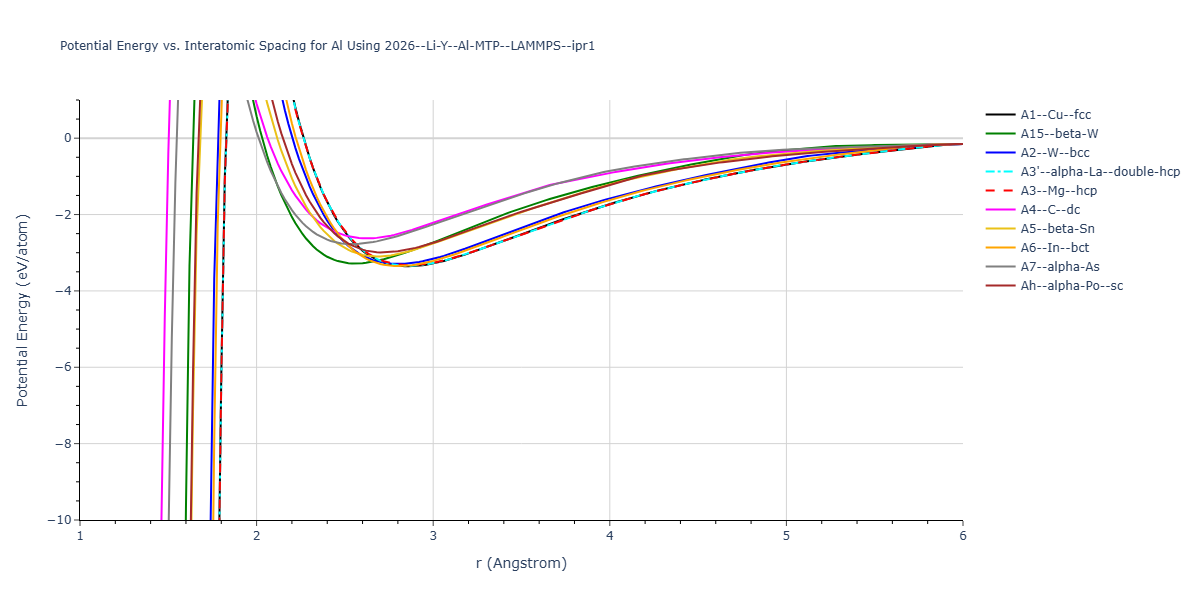
Cohesive Energy vs. Interatomic Spacing
Plots of potential energy vs interatomic spacing, r, are shown below for a number of crystal structures. The structures are generated based on the ideal atomic positions and b/a and c/a lattice parameter ratios for a given crystal prototype. The size of the system is then uniformly scaled, and the energy calculated without relaxing the system. To obtain these plots, values of r are evaluated every 0.02 Å up to 6 Å.
The calculation method used is available as the iprPy E_vs_r_scan calculation method.
Clicking on the image of a plot will open an interactive version of it in a new tab. The underlying data for the plots can be downloaded by clicking on the links above each plot.
Notes and Disclaimers:
- These values are meant to be guidelines for comparing potentials, not the absolute values for any potential's properties. Values listed here may change if the calculation methods are updated due to improvements/corrections. Variations in the values may occur for variations in calculation methods, simulation software and implementations of the interatomic potentials.
- The minima identified by this calculation do not guarantee that the associated crystal structures will be stable since no relaxation is performed.
- NIST disclaimer
Version Information:
- 2020-12-18. Descriptions, tables and plots updated to reflect that the energy values are the measuredper atom potential energy rather than cohesive energy as some potentials have non-zero isolated atom energies.
- 2019-02-04. Values regenerated with even r spacings of 0.02 Å, and now include values less than 2 Å when possible. Updated calculation method and parameters enhance compatibility with more potential styles.
- 2019-04-26. Results for hcp, double hcp, α-As and L10 prototypes regenerated from different unit cell representations. Only α-As results show noticable (>1e-5 eV) difference due to using a different coordinate for Wykoff site c position.
- 2018-06-13. Values for MEAM potentials corrected. Dynamic versions of the plots moved to separate pages to improve page loading. Cosmetic changes to how data is shown and updates to the documentation.
- 2017-01-11. Replaced png pictures with interactive Bokeh plots. Data regenerated with 200 values of r instead of 300.
- 2016-09-28. Plots for binary structures added. Data and plots for elemental structures regenerated. Data values match the values of the previous version. Data table formatting slightly changed to increase precision and ensure spaces between large values. Composition added to plot title and structure names made longer.
- 2016-04-07. Plots for elemental structures added.