-
Citation: S. Mukhopadhyay, S.K. Dinda, S.K. Singh, M. Ghosh, and S. Pal (2025), "Deformation Behavior Study of Single Crystal BaPt2 Compound Using Parameterized Embedded-Atom Method Potential—Part 1: Tensile and Creep Characteristics", Journal of Engineering Materials and Technology 148(2), 1-11. DOI: 10.1115/1.4070121.Abstract: Platinum-barium (Pt-Ba) alloy cathodes are promising for magnetron amplifiers due to their high electron emission coefficient and excellent work function. High-temperature deformation characteristics have the utmost importance with respect to these types of metal alloy cathodes. Molecular dynamics (MD) simulations have been carried out to study tensile and creep deformation characteristics of a single crystal BaPt2 compound using a parameterized embedded-atom method (EAM) potential. The force-matching methodology and an optimization approach using converged density-functional theory (DFT) datasets have been used in this work to parameterize an EAM potential for the Pt-Ba alloy system. A list of fundamental properties, such as density, cohesive energy, and elastic properties, has been investigated via MD simulation, and these properties have been verified with the help of DFT analysis to examine the performance of the potential. Tensile deformation characteristics have been carried out at different temperatures from 300 K to 1600 K for strain rates of 108/s, 109/s, 1010/s, and 1011/s. Ductile characteristics have been found, as supported by Pugh's criterion. In addition, creep characteristics have been studied at different loads ranging from 100 MPa to 400 MPa for temperatures 0.3 Tm, 0.6 Tm, and 0.8 Tm (i.e., Tm is the melting temperature), where no tertiary region has been observed. Additionally, X-ray diffraction spectra and radial distribution characteristics have also been visualized through MD simulation.Citation: S. Mukhopadhyay, S.K. Dinda, S.K. Singh, M. Ghosh, and S. Pal (2025), "Deformation Behavior Study of Single Crystal BaPt2 Compound Using Parameterized Embedded-Atom Method Potential: Part 2—Ratcheting Characteristics", Journal of Engineering Materials and Technology 148(2), 1-9. DOI: 10.1115/1.4070120.Abstract: The unavailability of embedded-atom method (EAM) potential for the Platinum-Barium (Pt-Ba) alloy system, which is an enticing choice as cathodes for magnetron amplifiers due to their high electron emission coefficient and excellent work function. The parameterization of an EAM potential for this alloy system has been described in part 1 portion. Studying different deformation mechanisms is crucial for these kinds of alloy systems in order to implement them in critical engineering applications. Tensile and creep characteristics have already been reported in part 1, along with the validation of density, cohesive energy, and elastic properties. Here, a list of other fundamental properties, such as lattice constant, surface energy, and lattice thermal conductivity, have been investigated via molecular dynamics (MD) simulation and compared with density-functional theory (DFT) analysis to concretize the accuracy of the potential. Thereafter, MD simulation has been used to study the deformation behavior of single crystal BaPt2 compound under asymmetric cyclic loading having "R" (stress ratio) of -0.2, -0.4, and -0.6 at different temperatures ranging from 300 K to 1600 K using the parameterized EAM potential. A constant strain rate of 108/s has been used in this present study. Although variations in strain axis are not significant, an increase in ratcheting strain with the increment in temperature and an increase in strain accumulation with the decrease in magnitude of stress ratio have been observed. Strain amplitude decreases and stabilizes at a terminal value, as observed from the strain cycle plot.
Notes: This EAM potential is designed to investigate different deformation characteristics of the BaPt2 laves phase compound. This EAM potential is useful for describing tensile, creep, and ratcheting characteristics of the BaPt2 laves phase compound.
-
LAMMPS pair_style eam/alloy (2025--Mukhopadhyay-S--Ba-Pt--LAMMPS--ipr1)See Computed Properties
Notes: This file was provided by Sankhasubhra Mukhopadhyay on Nov 24, 2025.
File(s):
Implementation Information
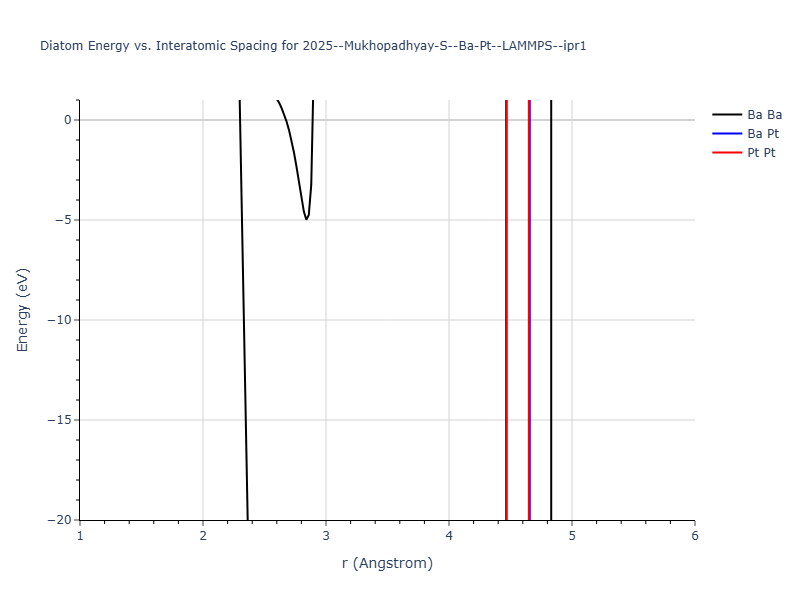
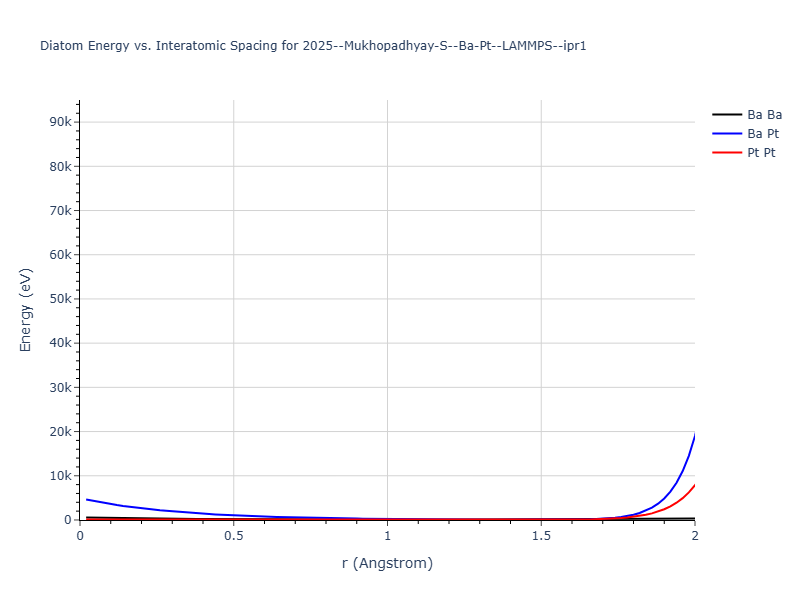
Diatom Energy vs. Interatomic Spacing
Plots of the potential energy vs interatomic spacing, r, are shown below for all diatom sets associated with the interatomic potential. This calculation provides insights into the functional form of the potential's two-body interactions. A system consisting of only two atoms is created, and the potential energy is evaluated for the atoms separated by 0.02 Å <= r <= 6.0> Å in intervals of 0.02 Å. Two plots are shown: one for the "standard" interaction distance range, and one for small values of r. The small r plot is useful for determining whether the potential is suitable for radiation studies.
The calculation method used is available as the iprPy diatom_scan calculation method.
Clicking on the image of a plot will open an interactive version of it in a new tab. The underlying data for the plots can be downloaded by clicking on the links above each plot.
Notes and Disclaimers:
- These values are meant to be guidelines for comparing potentials, not the absolute values for any potential's properties. Values listed here may change if the calculation methods are updated due to improvements/corrections. Variations in the values may occur for variations in calculation methods, simulation software and implementations of the interatomic potentials.
- As this calculation only involves two atoms, it neglects any multi-body interactions that may be important in molecules, liquids and crystals.
- NIST disclaimer
Version Information:
- 2019-11-14. Maximum value range on the shortrange plots are now limited to "expected" levels as details are otherwise lost.
- 2019-08-07. Plots added.
Click on plot to load interactive version
Click on plot to load interactive version
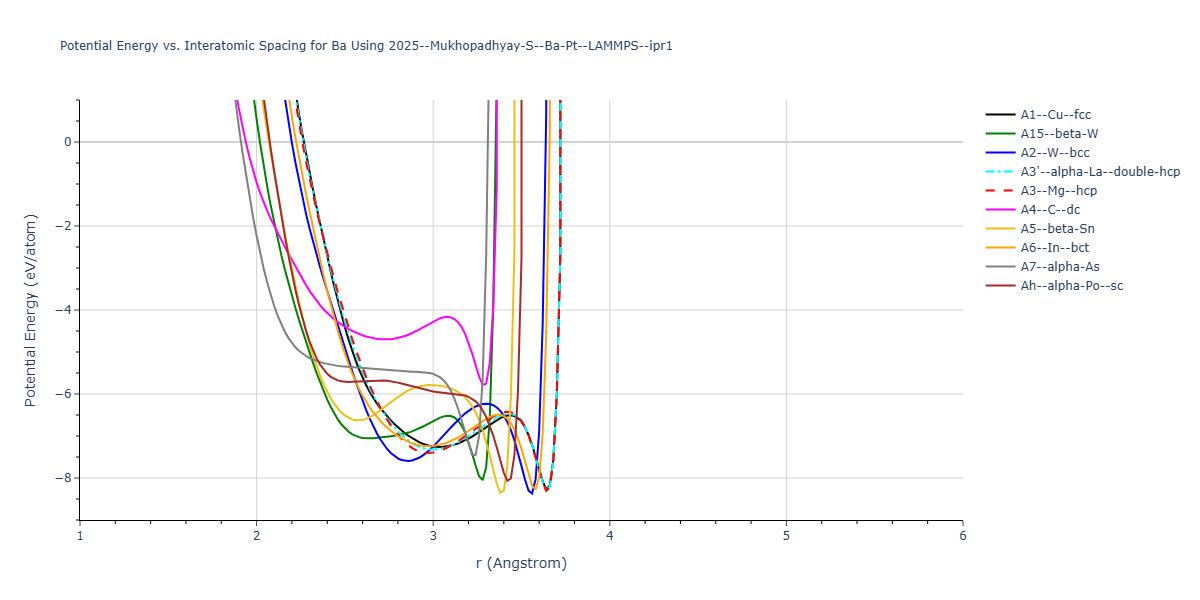
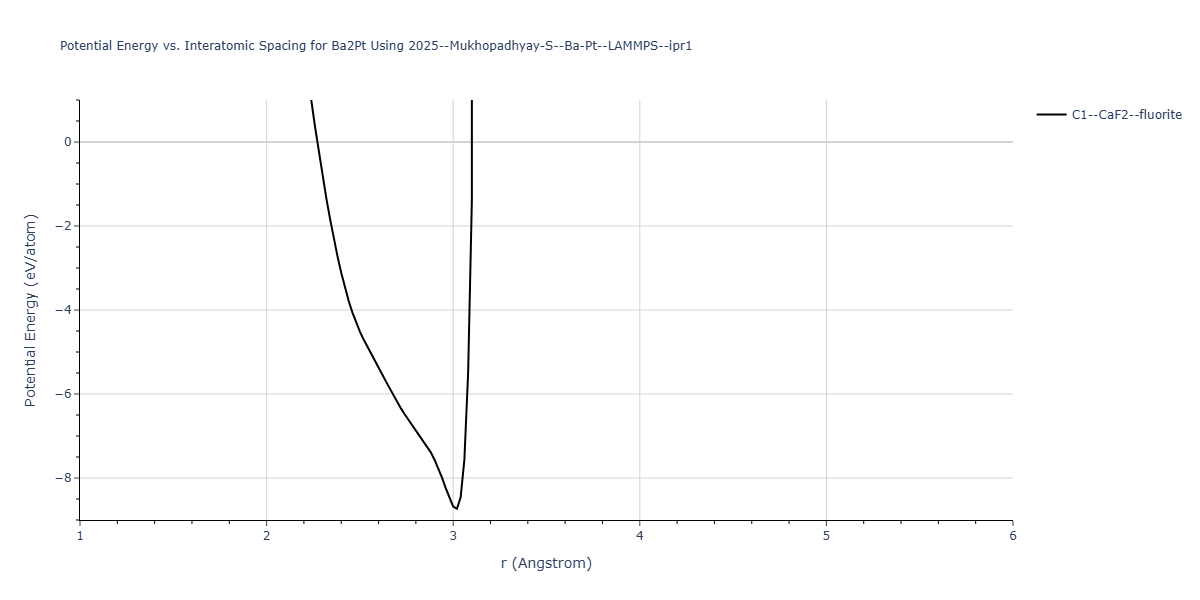
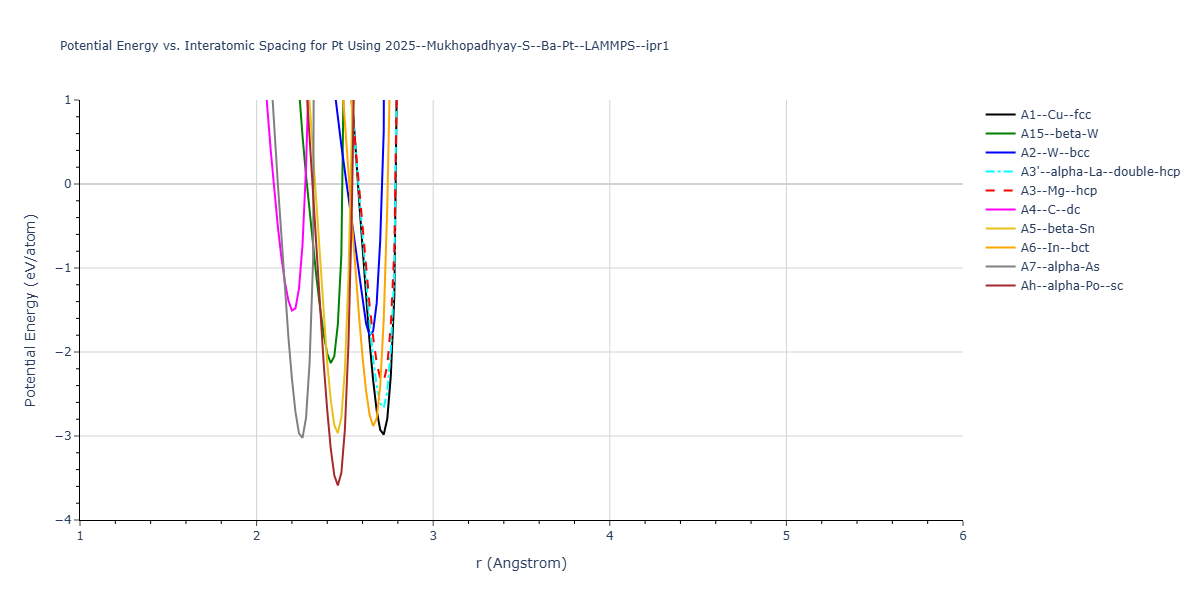
Cohesive Energy vs. Interatomic Spacing
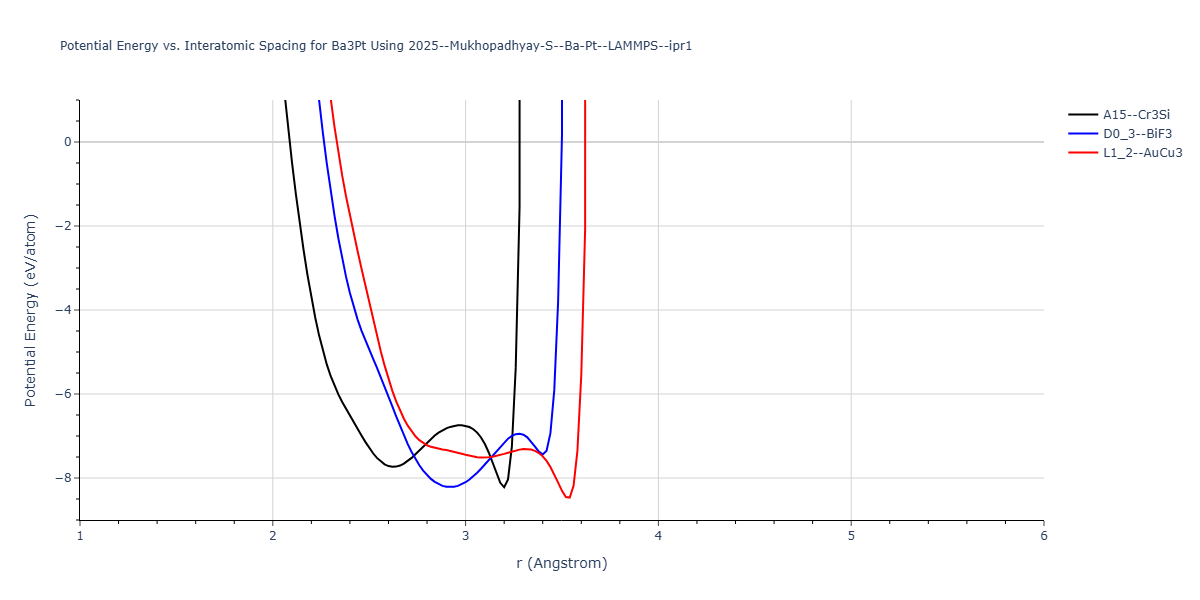
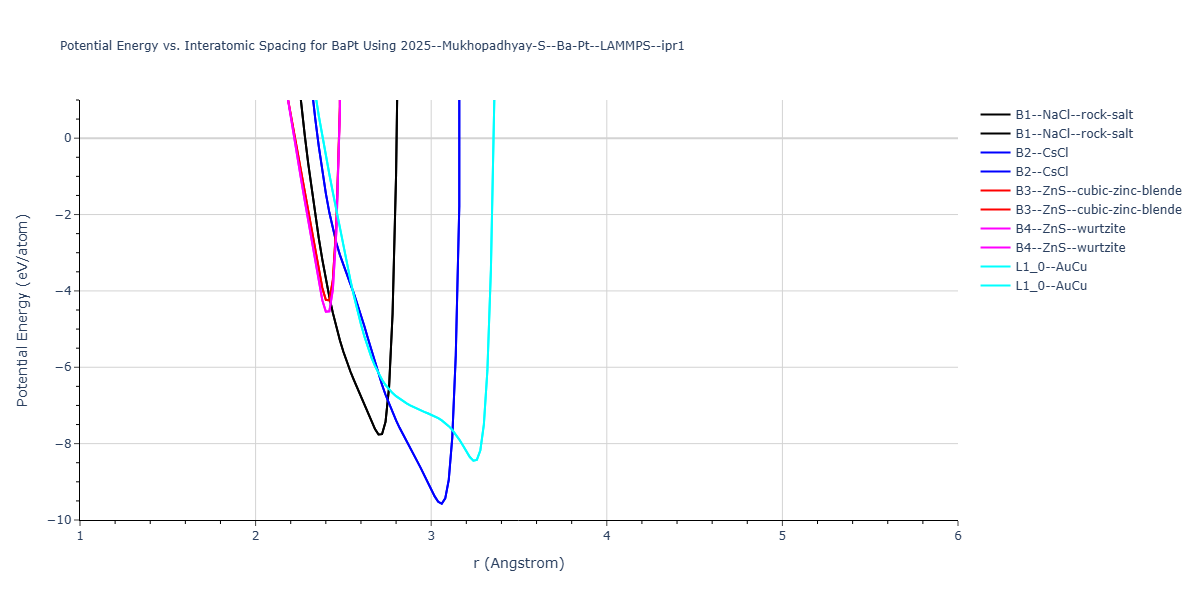
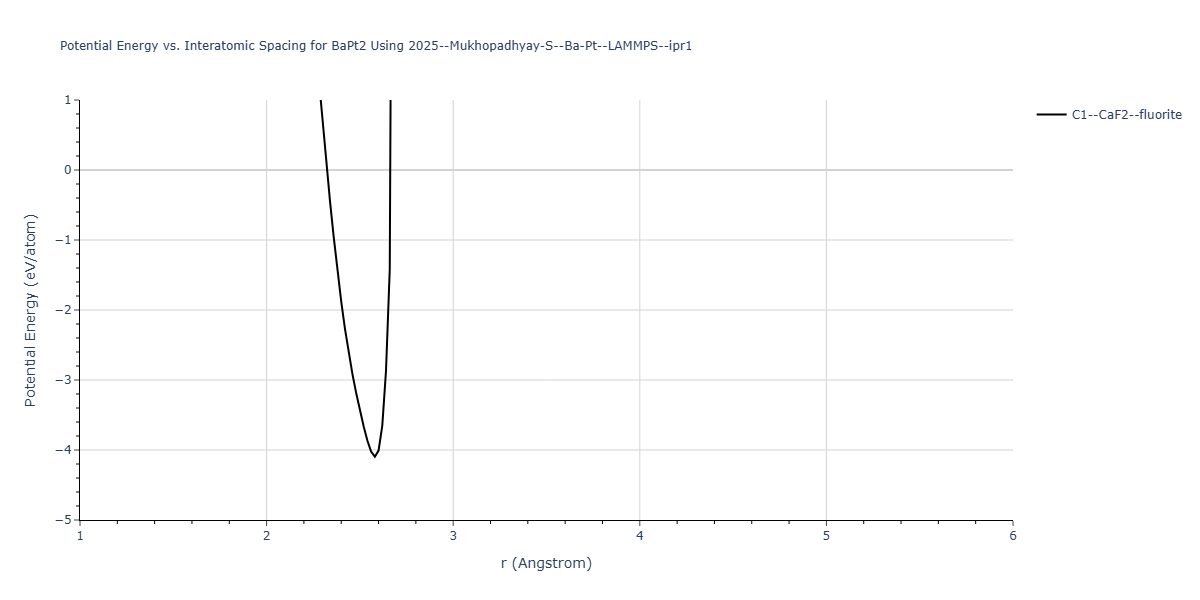
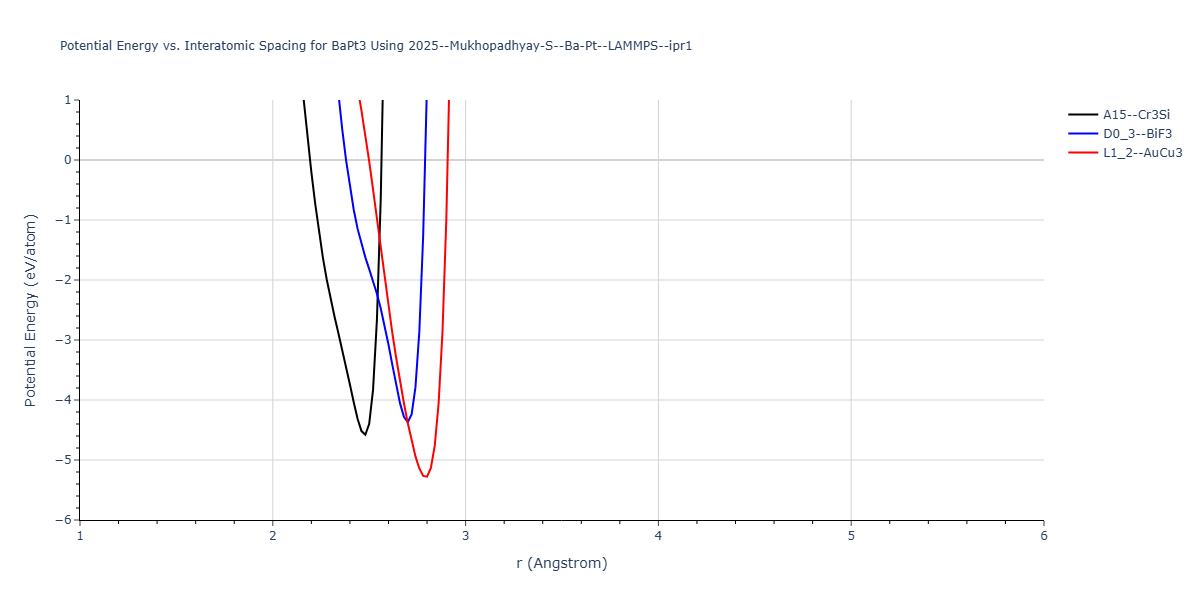
Plots of potential energy vs interatomic spacing, r, are shown below for a number of crystal structures. The structures are generated based on the ideal atomic positions and b/a and c/a lattice parameter ratios for a given crystal prototype. The size of the system is then uniformly scaled, and the energy calculated without relaxing the system. To obtain these plots, values of r are evaluated every 0.02 Å up to 6 Å.
The calculation method used is available as the iprPy E_vs_r_scan calculation method.
Clicking on the image of a plot will open an interactive version of it in a new tab. The underlying data for the plots can be downloaded by clicking on the links above each plot.
Notes and Disclaimers:
- These values are meant to be guidelines for comparing potentials, not the absolute values for any potential's properties. Values listed here may change if the calculation methods are updated due to improvements/corrections. Variations in the values may occur for variations in calculation methods, simulation software and implementations of the interatomic potentials.
- The minima identified by this calculation do not guarantee that the associated crystal structures will be stable since no relaxation is performed.
- NIST disclaimer
Version Information:
- 2020-12-18. Descriptions, tables and plots updated to reflect that the energy values are the measuredper atom potential energy rather than cohesive energy as some potentials have non-zero isolated atom energies.
- 2019-02-04. Values regenerated with even r spacings of 0.02 Å, and now include values less than 2 Å when possible. Updated calculation method and parameters enhance compatibility with more potential styles.
- 2019-04-26. Results for hcp, double hcp, α-As and L10 prototypes regenerated from different unit cell representations. Only α-As results show noticable (>1e-5 eV) difference due to using a different coordinate for Wykoff site c position.
- 2018-06-13. Values for MEAM potentials corrected. Dynamic versions of the plots moved to separate pages to improve page loading. Cosmetic changes to how data is shown and updates to the documentation.
- 2017-01-11. Replaced png pictures with interactive Bokeh plots. Data regenerated with 200 values of r instead of 300.
- 2016-09-28. Plots for binary structures added. Data and plots for elemental structures regenerated. Data values match the values of the previous version. Data table formatting slightly changed to increase precision and ensure spaces between large values. Composition added to plot title and structure names made longer.
- 2016-04-07. Plots for elemental structures added.
Crystal Structure Predictions
Computed lattice constants and cohesive/potential energies are displayed for a variety of crystal structures. The values displayed here are obtained using the following process.
- Initial crystal structure guesses are taken from:
- The iprPy E_vs_r_scan calculation results (shown above) by identifying all energy minima along the measured curves for a given crystal prototype + composition.
- Structures in the Materials Project and OQMD DFT databases.
- All initial guesses are relaxed using three independent methods using a 10x10x10 supercell:
- "box": The system's lattice constants are adjusted to zero pressure without internal relaxations using the iprPy relax_box calculation with a strainrange of 1e-6.
- "static": The system's lattice and atomic positions are statically relaxed using the iprPy relax_static calculation with a minimization force tolerance of 1e-10 eV/Angstrom.
- "dynamic": The system's lattice and atomic positions are dynamically relaxed for 10000 timesteps of 0.01 ps using the iprPy relax_dynamic calculation with an nph integration plus Langevin thermostat. The final configuration is then used as input in running an iprPy relax_static calculation with a minimization force tolerance of 1e-10 eV/Angstrom.
- The relaxed structures obtained from #2 are then evaluated using the spglib package to identify an ideal crystal unit cell based on the results.
- The space group information of the ideal unit cells is compared to the space group information of the corresponding reference structures to identify which structures transformed upon relaxation. The structures that did not transform to a different structure are listed in the table(s) below. The "method" field indicates the most rigorous relaxation method where the structure did not transform. The space group information is also used to match the DFT reference structures to the used prototype, where possible.
- The cohesive energy, Ecoh, is calculated from the measured potential energy per atom, Epot$, by subtracting the isolated energy averaged across all atoms in the unit cell. The isolated atom energies of each species model is obtained either by evaluating a single atom atomic configuration, or by identifying the first energy plateau from the diatom scan calculations for r > 2 Å.
The calculation methods used are implemented into iprPy as the following calculation styles
Notes and Disclaimers:
- These values are meant to be guidelines for comparing potentials, not the absolute values for any potential's properties. Values listed here may change if the calculation methods are updated due to improvements/corrections. Variations in the values may occur for variations in calculation methods, simulation software and implementations of the interatomic potentials.
- The presence of any structures in this list does not guarantee that those structures are stable. Also, the lowest energy structure may not be included in this list.
- Multiple values for the same crystal structure but different lattice constants are possible. This is because multiple energy minima are possible for a given structure and interatomic potential. Having multiple energy minima for a structure does not necessarily make the potential "bad" as unwanted configurations may be unstable or correspond to conditions that may not be relevant to the problem of interest (eg. very high strains).
- NIST disclaimer
Version Information:
- 2025-07-02. All "mp-" reference structure calculations were re-relaxed using the updated Materials Project database rather than the original database structures. Also, a bug was fixed that caused the "static" relaxations to occasionally throw unnecessary errors. This was fixed and all affected calculations were reset and performed again.
- 2022-05-27. The "box" method results have all been redone with an updated methodology more suited for non-orthogonal systems.
- 2020-12-18. Cohesive energies have been corrected by making them relative to the energies of the isolated atoms. The previous cohesive energy values are now listed as the potential energies.
- 2019-06-07. Structures with positive or near zero cohesive energies removed from the display tables. All values still present in the raw data files.
- 2019-04-26. Calculations now computed for each implementation. Results for hcp, double hcp, α-As and L10 prototypes regenerated from different unit cell representations.
- 2018-06-14. Methodology completely changed affecting how the information is displayed. Calculations involving MEAM potentials corrected.
- 2016-09-28. Values for simple compounds added. All identified energy minima for each structure are listed. The existing elemental data was regenerated. Most values are consistent with before, but some differences have been noted. Specifically, variations are seen with some values for potentials where the elastic constants don't vary smoothly near the equilibrium state. Additionally, the inclusion of some high-energy structures has changed based on new criteria for identifying when structures have relaxed to another structure.
- 2016-04-07. Values for elemental crystal structures added. Only values for the global energy minimum of each unique structure given.
Download raw data (including filtered results)
Reference structure matches:
| prototype | method | Ecoh (eV/atom) | Epot (eV/atom) | a0 (Å) | b0 (Å) | c0 (Å) | α (degrees) | β (degrees) | γ (degrees) |
|---|---|---|---|---|---|---|---|---|---|
| Ah--alpha-Po--sc | static | -1.5583462174303e+19 | -1.5583462174303e+19 | 5.4635 | 5.4635 | 5.4635 | 90.0 | 90.0 | 90.0 |
| A4--C--dc | static | -1.5583462174302499e+19 | -1.5583462174302499e+19 | 12.3342 | 12.3342 | 12.3342 | 90.0 | 90.0 | 90.0 |
| A7--alpha-As | static | -1.5583462174302001e+19 | -1.5583462174302001e+19 | 7.8489 | 7.8489 | 21.8018 | 90.0 | 90.0 | 120.0 |
| A3--Mg--hcp | static | -1.5583462174302e+19 | -1.5583462174302e+19 | 5.664 | 5.664 | 9.2502 | 90.0 | 90.0 | 120.0 |
| A3'--alpha-La--double-hcp | static | -1.5583462174302e+19 | -1.5583462174302e+19 | 5.664 | 5.664 | 18.5004 | 90.0 | 90.0 | 120.0 |
| A1--Cu--fcc | static | -1.5583462174302e+19 | -1.5583462174302e+19 | 8.0109 | 8.0109 | 8.0109 | 90.0 | 90.0 | 90.0 |
| A6--In--bct | static | -1.5583462174302e+19 | -1.5583462174302e+19 | 5.5612 | 5.5612 | 8.3415 | 90.0 | 90.0 | 90.0 |
| A5--beta-Sn | static | -1.5583462174302e+19 | -1.5583462174302e+19 | 10.3893 | 10.3893 | 5.7107 | 90.0 | 90.0 | 90.0 |
| A2--W--bcc | static | -1.5583462174302e+19 | -1.5583462174302e+19 | 6.4102 | 6.4102 | 6.4102 | 90.0 | 90.0 | 90.0 |
| A15--beta-W | static | -3.649077636682625e+18 | -3.649077636682625e+18 | 10.1206 | 10.1206 | 10.1206 | 90.0 | 90.0 | 90.0 |
| A5--beta-Sn | static | -8.3871 | -8.3871 | 6.5985 | 6.5985 | 3.5123 | 90.0 | 90.0 | 90.0 |
| A2--W--bcc | static | -8.3793 | -8.3793 | 4.1051 | 4.1051 | 4.1051 | 90.0 | 90.0 | 90.0 |
| A6--In--bct | static | -8.3725 | -8.3725 | 4.4493 | 4.4493 | 3.538 | 90.0 | 90.0 | 90.0 |
| A3--Mg--hcp | box | -8.3207 | -8.3207 | 3.6395 | 3.6395 | 5.9763 | 90.0 | 90.0 | 120.0 |
| A6--In--bct | box | -8.2775 | -8.2775 | 3.5752 | 3.5752 | 5.3716 | 90.0 | 90.0 | 90.0 |
| A1--Cu--fcc | box | -8.276 | -8.276 | 5.1563 | 5.1563 | 5.1563 | 90.0 | 90.0 | 90.0 |
| Ah--alpha-Po--sc | box | -8.0873 | -8.0873 | 3.4273 | 3.4273 | 3.4273 | 90.0 | 90.0 | 90.0 |
| A15--beta-W | static | -8.0552 | -8.0552 | 6.5538 | 6.5538 | 6.5538 | 90.0 | 90.0 | 90.0 |
| A2--W--bcc | dynamic | -7.5948 | -7.5948 | 3.2968 | 3.2968 | 3.2968 | 90.0 | 90.0 | 90.0 |
| A3--Mg--hcp | dynamic | -7.4422 | -7.4422 | 3.0515 | 3.0515 | 4.6905 | 90.0 | 90.0 | 120.0 |
| A3'--alpha-La--double-hcp | dynamic | -7.3357 | -7.3357 | 3.0418 | 3.0418 | 9.5749 | 90.0 | 90.0 | 120.0 |
| A1--Cu--fcc | dynamic | -7.261 | -7.261 | 4.2932 | 4.2932 | 4.2932 | 90.0 | 90.0 | 90.0 |
| A15--beta-W | static | -7.0564 | -7.0564 | 5.2766 | 5.2766 | 5.2766 | 90.0 | 90.0 | 90.0 |
| A5--beta-Sn | static | -6.6384 | -6.6384 | 4.9232 | 4.9232 | 2.7689 | 90.0 | 90.0 | 90.0 |
| A4--C--dc | static | -5.8082 | -5.8082 | 7.5957 | 7.5957 | 7.5957 | 90.0 | 90.0 | 90.0 |
| Ah--alpha-Po--sc | box | -5.7119 | -5.7119 | 2.5237 | 2.5237 | 2.5237 | 90.0 | 90.0 | 90.0 |
| A4--C--dc | static | -4.7019 | -4.7019 | 6.301 | 6.301 | 6.301 | 90.0 | 90.0 | 90.0 |
| Ah--alpha-Po--sc | dynamic | 0.0 | 0.0 | 391.2189 | 391.2189 | 391.2189 | 90.0 | 90.0 | 90.0 |
| A2--W--bcc | static | 4.615983306759e+16 | 4.615983306759e+16 | 6.2346 | 6.2346 | 6.2346 | 90.0 | 90.0 | 90.0 |
| A4--C--dc | static | 4.615983306759375e+16 | 4.615983306759375e+16 | 11.9606 | 11.9606 | 11.9606 | 90.0 | 90.0 | 90.0 |