-
Citation: W.-S. Ko, E.Y. Yoon, J.B. Jeon, and Y. Lee (2022), "Atomistic simulations of AuTi high-temperature shape memory alloys", International Journal of Mechanical Sciences 227, 107467. DOI: 10.1016/j.ijmecsci.2022.107467.Abstract: Herein, the atomic-scale phase transformation and deformation processes of AuTi shape memory alloys for high-temperature applications were investigated using molecular dynamics simulations based on a newly developed interatomic potential for the Au-Ti binary system. The developed second nearest-neighbor modified embedded-atom method potential exhibited good accuracy and transferability to reproduce various physical properties of the target alloy system, particularly in properties related to the reversible phase transformation of AuTi high-temperature shape memory alloys. As a conceivable application of the interatomic potential, the temperature-induced phase transformation of AuTi single-crystal shape memory alloys and the effect of off-stoichiometry on the phase transformation behavior were examined. Molecular dynamics simulations revealed that the transformation temperature and thermal hysteresis decreased with increasing Ti content, consistent with the reported experimental trend, suggesting that the reduced volume difference between the austenite and martensite phases was closely related to the reduced thermal hysteresis. We further examined the mechanical response and resultant superelasticity of nanocrystalline AuTi alloys to demonstrate that the cyclic deformation of nanocrystalline alloys exhibited a transformation ratcheting behavior caused by the plastic deformation of amorphous-like grain boundary region.
Related Models: -
LAMMPS pair_style meam (2022--Ko-W-S--Au-Ti--LAMMPS--ipr1)See Computed Properties
Notes: These files were provided by Won-Seok Ko on June 2, 2026. The README.md file contains usage notes, element ordering, reference structures, and recommended cutoff values.
File(s):
Implementation Information
Diatom Energy vs. Interatomic Spacing
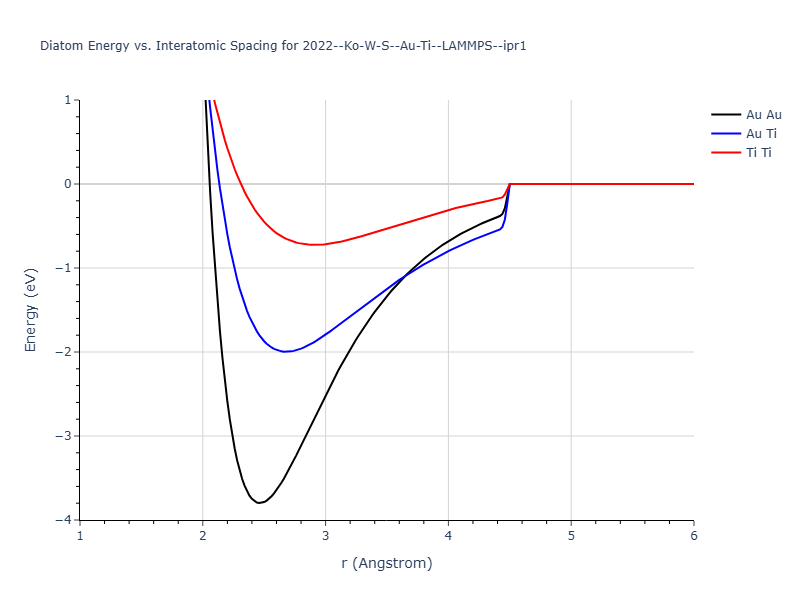
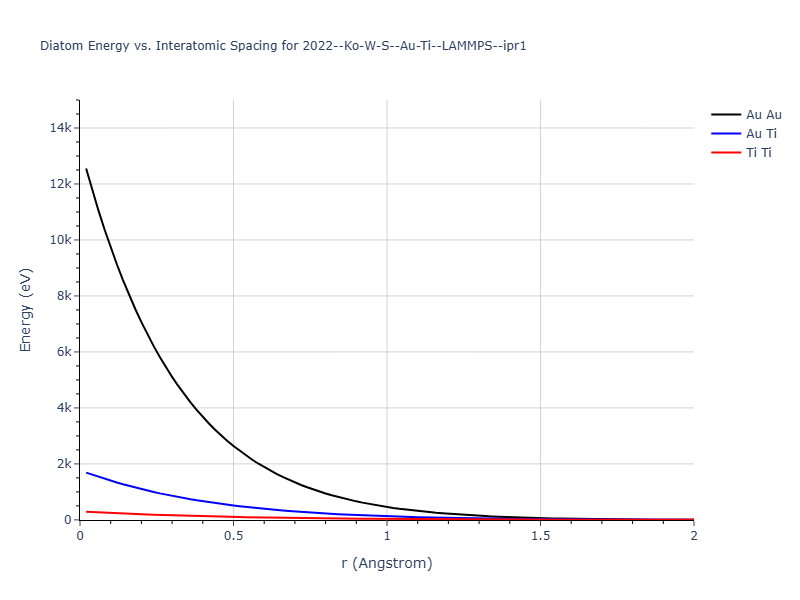
Plots of the potential energy vs interatomic spacing, r, are shown below for all diatom sets associated with the interatomic potential. This calculation provides insights into the functional form of the potential's two-body interactions. A system consisting of only two atoms is created, and the potential energy is evaluated for the atoms separated by 0.02 Å <= r <= 6.0> Å in intervals of 0.02 Å. Two plots are shown: one for the "standard" interaction distance range, and one for small values of r. The small r plot is useful for determining whether the potential is suitable for radiation studies.
The calculation method used is available as the iprPy diatom_scan calculation method.
Clicking on the image of a plot will open an interactive version of it in a new tab. The underlying data for the plots can be downloaded by clicking on the links above each plot.
Notes and Disclaimers:
- These values are meant to be guidelines for comparing potentials, not the absolute values for any potential's properties. Values listed here may change if the calculation methods are updated due to improvements/corrections. Variations in the values may occur for variations in calculation methods, simulation software and implementations of the interatomic potentials.
- As this calculation only involves two atoms, it neglects any multi-body interactions that may be important in molecules, liquids and crystals.
- NIST disclaimer
Version Information:
- 2019-11-14. Maximum value range on the shortrange plots are now limited to "expected" levels as details are otherwise lost.
- 2019-08-07. Plots added.
Click on plot to load interactive version
Click on plot to load interactive version
Cohesive Energy vs. Interatomic Spacing
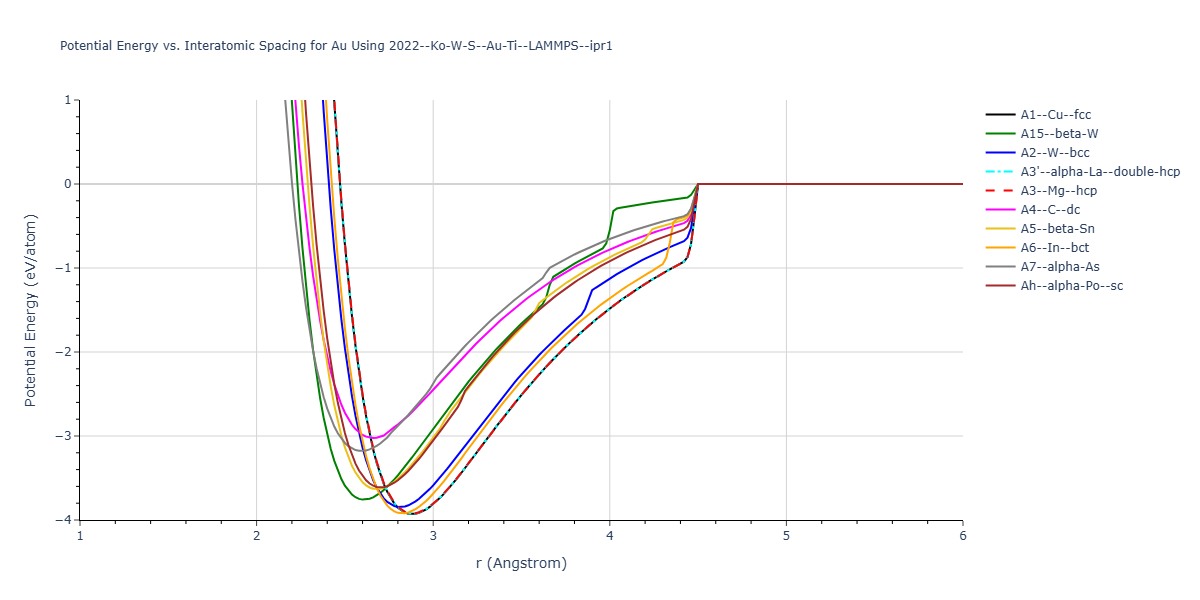
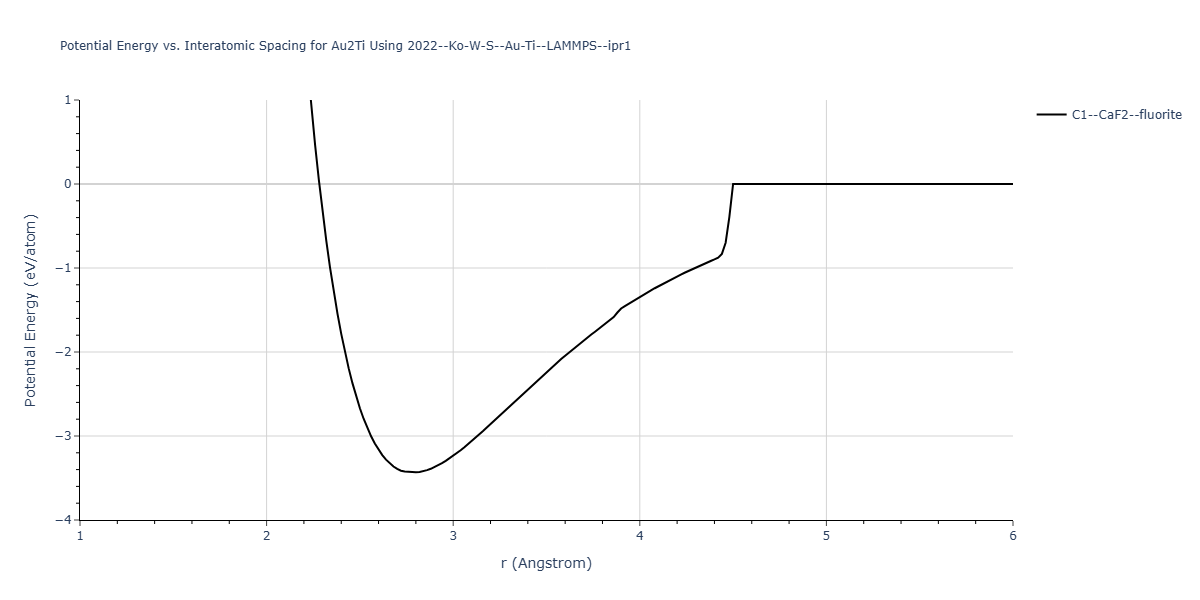
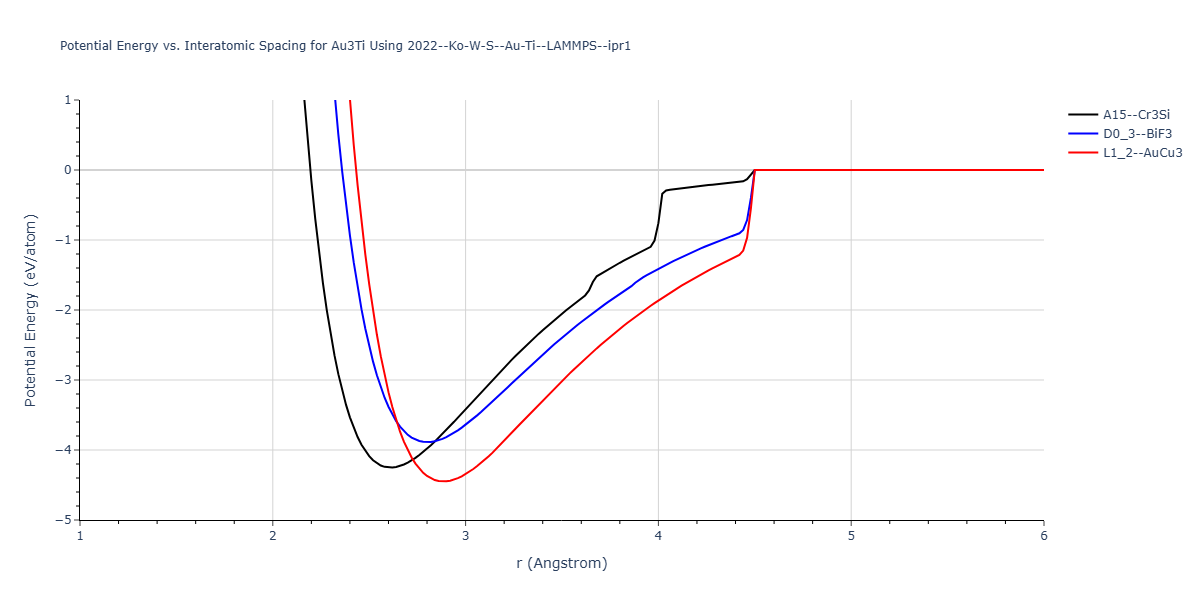
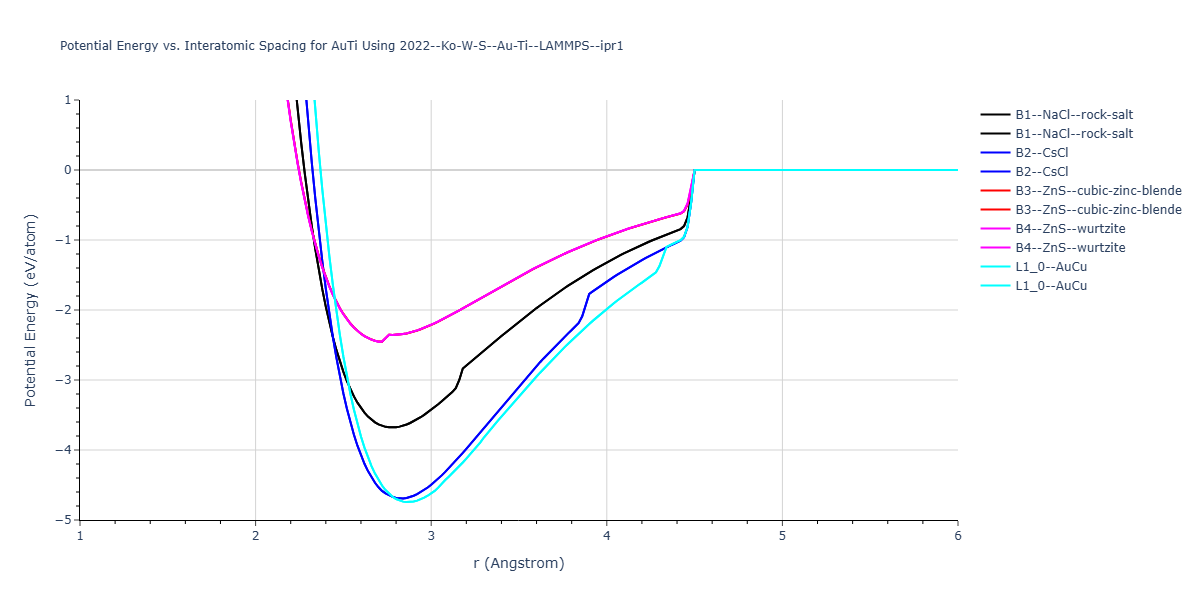
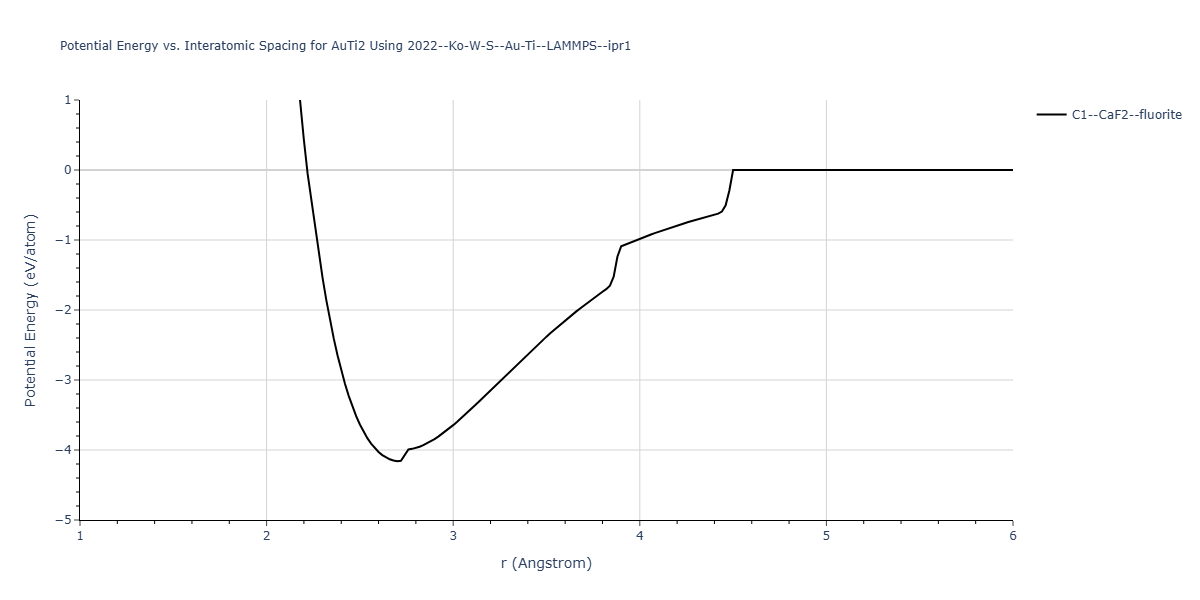
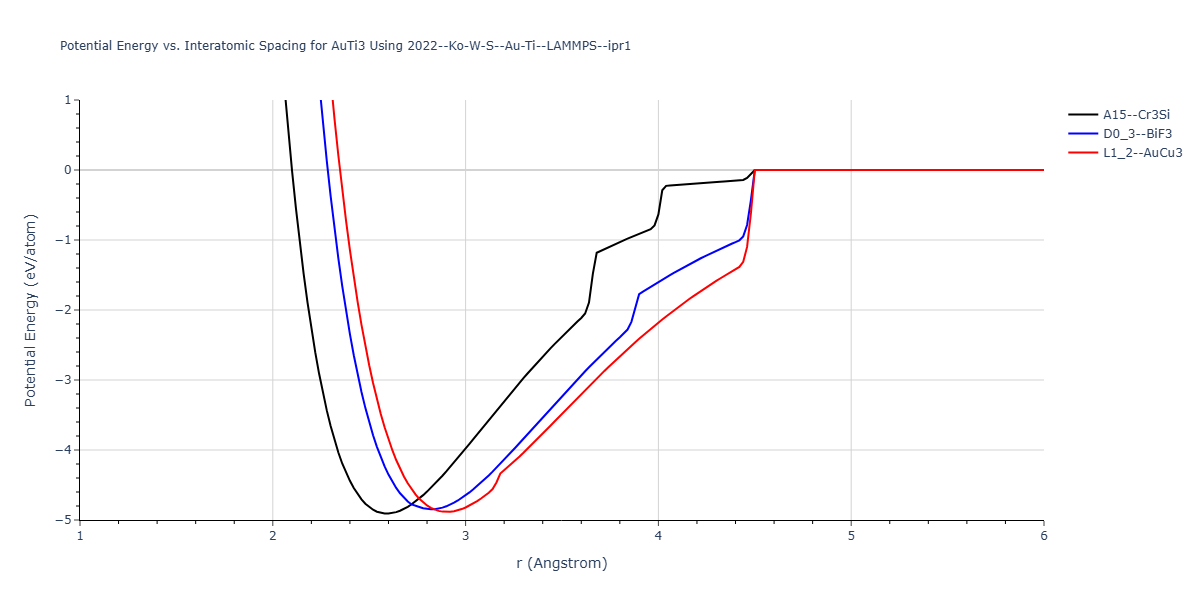
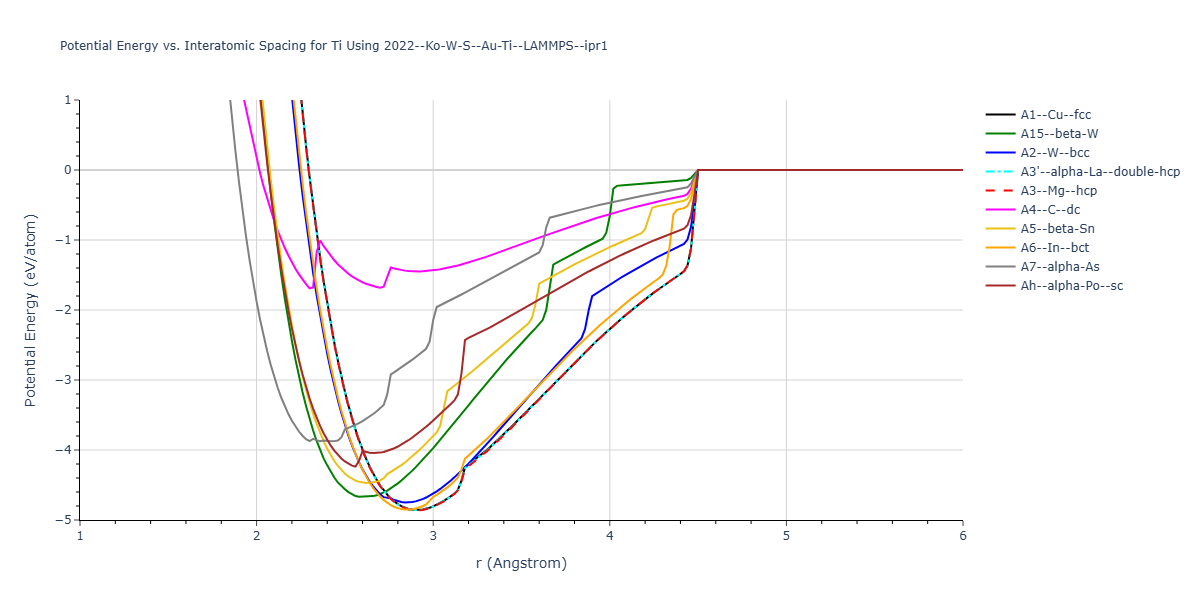
Plots of potential energy vs interatomic spacing, r, are shown below for a number of crystal structures. The structures are generated based on the ideal atomic positions and b/a and c/a lattice parameter ratios for a given crystal prototype. The size of the system is then uniformly scaled, and the energy calculated without relaxing the system. To obtain these plots, values of r are evaluated every 0.02 Å up to 6 Å.
The calculation method used is available as the iprPy E_vs_r_scan calculation method.
Clicking on the image of a plot will open an interactive version of it in a new tab. The underlying data for the plots can be downloaded by clicking on the links above each plot.
Notes and Disclaimers:
- These values are meant to be guidelines for comparing potentials, not the absolute values for any potential's properties. Values listed here may change if the calculation methods are updated due to improvements/corrections. Variations in the values may occur for variations in calculation methods, simulation software and implementations of the interatomic potentials.
- The minima identified by this calculation do not guarantee that the associated crystal structures will be stable since no relaxation is performed.
- NIST disclaimer
Version Information:
- 2020-12-18. Descriptions, tables and plots updated to reflect that the energy values are the measuredper atom potential energy rather than cohesive energy as some potentials have non-zero isolated atom energies.
- 2019-02-04. Values regenerated with even r spacings of 0.02 Å, and now include values less than 2 Å when possible. Updated calculation method and parameters enhance compatibility with more potential styles.
- 2019-04-26. Results for hcp, double hcp, α-As and L10 prototypes regenerated from different unit cell representations. Only α-As results show noticable (>1e-5 eV) difference due to using a different coordinate for Wykoff site c position.
- 2018-06-13. Values for MEAM potentials corrected. Dynamic versions of the plots moved to separate pages to improve page loading. Cosmetic changes to how data is shown and updates to the documentation.
- 2017-01-11. Replaced png pictures with interactive Bokeh plots. Data regenerated with 200 values of r instead of 300.
- 2016-09-28. Plots for binary structures added. Data and plots for elemental structures regenerated. Data values match the values of the previous version. Data table formatting slightly changed to increase precision and ensure spaces between large values. Composition added to plot title and structure names made longer.
- 2016-04-07. Plots for elemental structures added.