FiPy
FiPyexamples.levelSet.electroChem.gold
Model electrochemical superfill of gold using the CEAC mechanism.
This input file is a demonstration of the use of FiPy for modeling gold superfill. The material properties and experimental parameters used are roughly those that have been previously published [30].
To run this example from the base FiPy directory type:
$ python examples/levelSet/electroChem/gold.py
at the command line. The results of the simulation will be displayed and the word
finished in the terminal at the end of the simulation. The simulation will
only run for 10 time steps. To run with a different number of time steps change
the numberOfSteps argument as follows,
>>> runGold(numberOfSteps=10, displayViewers=False)
1
Change the displayViewers argument to True if you wish to see the
results displayed on the screen. This example has a more realistic
default boundary layer depth and thus requires gmsh to construct a
more complex mesh.
There are a few differences between the gold superfill model presented
in this example and in examples.levelSet.electroChem.simpleTrenchSystem.
Most default
values have changed to account for a different metal ion (gold)
and catalyst (lead). In this system the catalyst is not present in
the electrolyte but instead has a non-zero initial coverage. Thus
quantities associated with bulk catalyst and catalyst accumulation
are not defined. The current density is given by,

The
more common representation of the current density includes an
exponential part. Here it is buried in  and
and  . The
governing equation for catalyst evolution includes a term for
catalyst consumption on the interface and is given by
. The
governing equation for catalyst evolution includes a term for
catalyst consumption on the interface and is given by

where  is the consumption coefficient
(
is the consumption coefficient
(consumptionRateConstant). The trench geometry is also given a
slight taper, given by taperAngle.
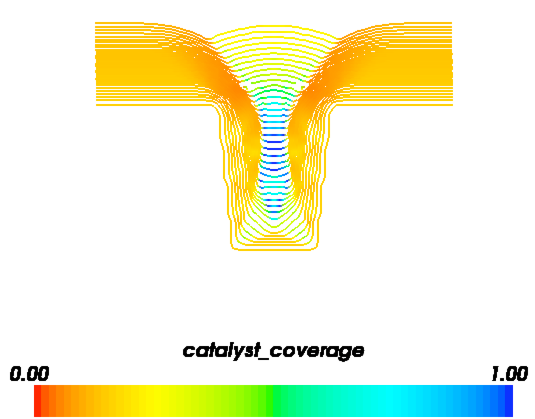
If the Mayavi plotting software is installed (see Installation) then a plot should appear that is updated every 10 time steps and will eventually resemble the image below.