|
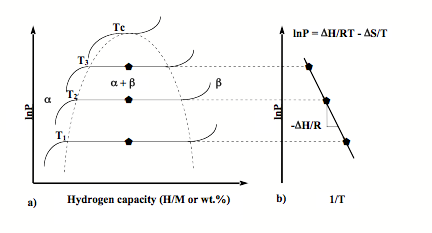
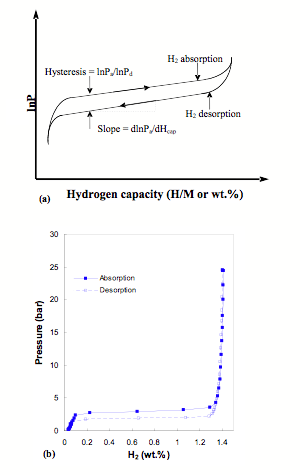
Pressure-Composition-Temperature (PCT) measurements The thermodynamic aspects of the hydride formation from gaseous hydrogen can be described by pressure-composition temperature (PCT) curves, which is also called pressure-composition isotherm (PCI). An idealized PCT curve is shown in Fig 1. The metal initially dissolves only low amount of hydrogen which creates solid solution of hydrogen in metal matrix (a- phase). As the concentration of dissolved H is increased, at some pressure or composition, nucleation and growth of the ordered hydride phase b start. While the two phases, a and b coexist, the isotherms show a plateau, the length of which determines the amount of hydrogen that can be stored reversibly with small pressure variations. It can be seen that increasing temperature increases plateau pressure and beyond the critical temperature Tc, plateau region disappears and the a phase converts to b phase continuously. The two phase region ends in a critical point Tc. The plateau pressure Peq strongly depends on temperature. The equilibrium pressure Peq as a function of temperature is related to the changes DH and DS of enthalpy and entropy, respectively, by the Van’t Hoff equation: As shown in Fig. 1b, a plot of ln Peq vs. 1/T tends to be a straight line with the slope equal to DH and intercept (1/T=0) equal to DS. The knowledge of enthalpy change is important to the heat management required for hydride storage devices and is also a measure of the strength of the M-H chemical bond. The Van’t Hoff plot is a convenient way to graphically represent hydride thermal stability, especially to compare different solid state hydrogen storage systems. In real metal hydrides, PCT curves do not show flat plateau or zero hysteresis. Most of hydriding metals will show PCT curves with sloping plateau and hysteresis loop (Fig. 5). Articles related to PCT apparatus
Figures
|