OOF2: The Manual
| 4.7.8. The Mesh Info Toolbox | ||
|---|---|---|

|
4.7. Toolboxes |  |
The Mesh Info Toolbox displays information about the topmost
Mesh Layer in the Canvas. It works more or less like the
Skeleton Info
Toolbox, except that it has only two modes, Element and
Node, and has a button for creating a Data Viewer.
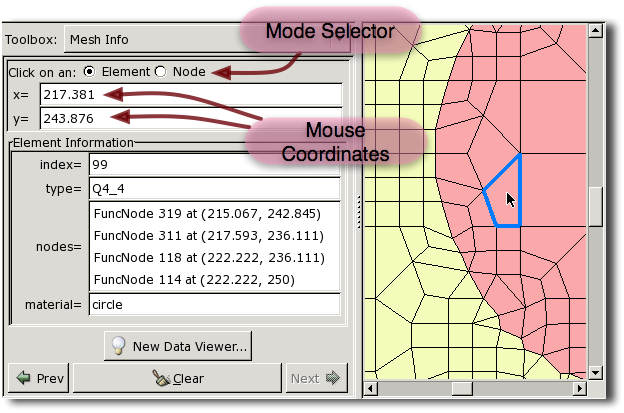
Figure 4.14 depicts the Mesh Info Toolbox. The two buttons at the top, labelled Element and Node determine the Toolbox's operating mode and what information will be displayed when the mouse is clicked on the the Canvas. Below the mode buttons are boxes that show the coordinates of the mouse click, in physical units.
In both Element and Node modes, the queried Mesh component is
highlighted in the Canvas. The
button at the bottom of the Toolbox erases the highlighting and
clears the data listing. The and
buttons on either side cycle through
the previously selected objects (changing the Toolbox mode, if
necessary).
In Element mode, the Element being
queried is highlighted with a blue perimeter,[12]
as shown in the figure. The following data is displayed in the
Toolbox:
-
The
Element's index. This is just an integer used to identify theElement. All of theElements in a Mesh have a unique index. -
The
Element's type.Elementtypes are discussed in Element3 (triangles) and Element4 (quadrilaterals). -
A list of the
Nodesof theElement. Two types of Nodes are listed.Nodesidentified simply as “Node” determine the shape of theElement, but do not carryFieldvalues.Nodesmarked “FuncNode” (for “Function Node”) haveFieldvalues defined at them. The index and position (in physical coordinates) of eachNodeare listed as well.Clicking on a
Nodein the list highlights it with a pink dot[12] in the Canvas. Double-clicking switches the Toolbox into Node Mode, and displays the data for the double-clickedNode. -
The
Materialassigned to theElement.
In Node mode, the Node being queried is
highlighted in the Canvas with a blue dot.[12] The following data is
displayed in the Toolbox:
The value of Fields and Fluxes and other Mesh-dependent
quantities are not given
in the Mesh Info Toolbox, because there wouldn't be room for all
of them. The button in
the Toolbox opens a Data Viewer window,
which can be set to display numerically any quantity that can be
plotted in an OOF2 contour
plot. Any number of Data Viewers may be open at one
time. Clicking the mouse in the Canvas while the Mesh Info
Toolbox is open will update the information in all Data Viewers
that belong to that Canvas, unless the viewer is
frozen (see below).
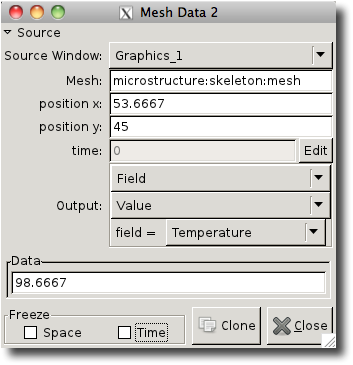
Figure 4.15 shows what the Data Viewer looks like. At the top of the window is a triangle labelled Source, which can be clicked to show and hide the following widgets, all of which conspire to determine what data will be displayed:
-
A pull-down menu labelled Source Window that lists all of the available Graphics Windows. The Viewer gets its information from the selected Graphics Window.
-
A Mesh box indicating which
Meshis the source of the data. It will always be the topmostMeshdisplayed in the Canvas of the Source Window. -
Two position boxes that give the physical coordinates of the mouse click. The text in these boxes can be edited by hand, in case you didn't click exactly where you wanted to on the Canvas.
-
A grayed-out time box that displays the
Meshtime when the data was computed. This cannot be edited directly, because doing so would require that theMeshdata be interpolated to a new time at each keystroke. To change the time, click the button to the right of the box. The button will metamorphose into a button and the box will no longer be grayed out (but the rest of the window will be). Type the new time, and click . Entering a new time in this way will automatically freeze the window's time. -
A set of pull-down menus labelled Output that specify what quantity will be displayed in response to mouse clicks on the Canvas.
Figure 4.16 shows the Data Viewer window in its collapsed state. (After collapsing the widgets, it's unfortunately necessary to resize the window by hand.)
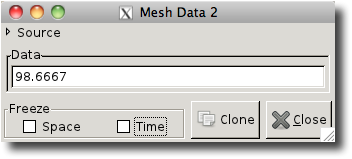
Below the Output menus is a region for displaying the output values. The size and format of this region varies according to the type of Output. At the bottom of the window are two checkboxes and two buttons.
-
When the checkbox in the Freeze frame is checked, the data displayed in the window will not be updated when a new location is selected by clicking the mouse on the Canvas.
-
When the checkbox in the Freeze frame is checked, the data displayed in the window will not be updated when the time of the
Meshdisplayed in the Canvas changes. -
The button creates an identical copy of the Data Viewer window.
-
The button simply closes the Data Viewer window.
[12]
The color and size of the decorations used to highlight the
queried Elements and Nodes may be
changed by editing the MeshInfoDisplay display Layer.
This Layer is predefined and always displays the topmost
Mesh. It will be necessary to enable List
All Layers in the Settings
menu in order to edit the Layer.
|
|
 |
|
| 4.7. Toolboxes |  |
4.8. The Layer Editor |