OOF: Finite Element Analysis of Microstructures
Next: Attributes Dashboard Up: The Dashboards Previous: The Dashboards Contents
Coordinates Dashboard
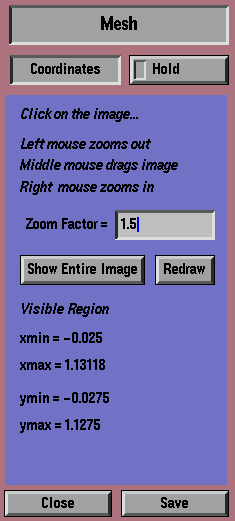
The Coordinates Dashboard (Figure 5.1) determines what part of the grid is visible in the Drawing Area.
The physical coordinates of the corners of the visible image are printed at the bottom of the Dashboard.
Clicking the right mouse button in the image zooms in around the point of the click. That is, the clicked point in the image stays (more or less) under the mouse, but the size of the image increases by the Zoom Factor. The Zoom Factor can be set in the input field in the dash board. Similarly, clicking on the image with the left mouse button zooms out--the image shrinks in the window.
The image can be moved within the Drawing Area by clicking and dragging with the middle mouse button.
The button labeled Show Entire Image shifts and scales the image so that it is all visible. The button labeled Redraw redraws the image, if it has somehow become corrupted.
When the image has been zoomed or shifted so that not all of it is visible, the Scroll Bars along its top and left edges become active. Moving the scroll bars with any mouse button shifts the image. The scroll bars are available no matter which Dashboard is open.
Clicking on the Zoom Button at the upper left corner of the Drawing Area is subtly different than clicking in the Drawing Area itself. Right and left mouse clicks on the Zoom button zoom in and out while keeping the point at the center of the window fixed. The middle mouse button clicked on the Zoom button duplicates the behavior of the Show Entire Image button. The Zoom button is also available no matter which Dashboard is open.
Next: Attributes Dashboard Up: The Dashboards Previous: The Dashboards Contents /* Send mail to the OOF Team *//* Go to the OOF Home Page */
